
World and country maps are impressive media to use, when it comes to presenting data bases. In the time of globalisation such data becomes more and more important, so you might be in need of such mappings real soon (or you already are and that is why you are here).
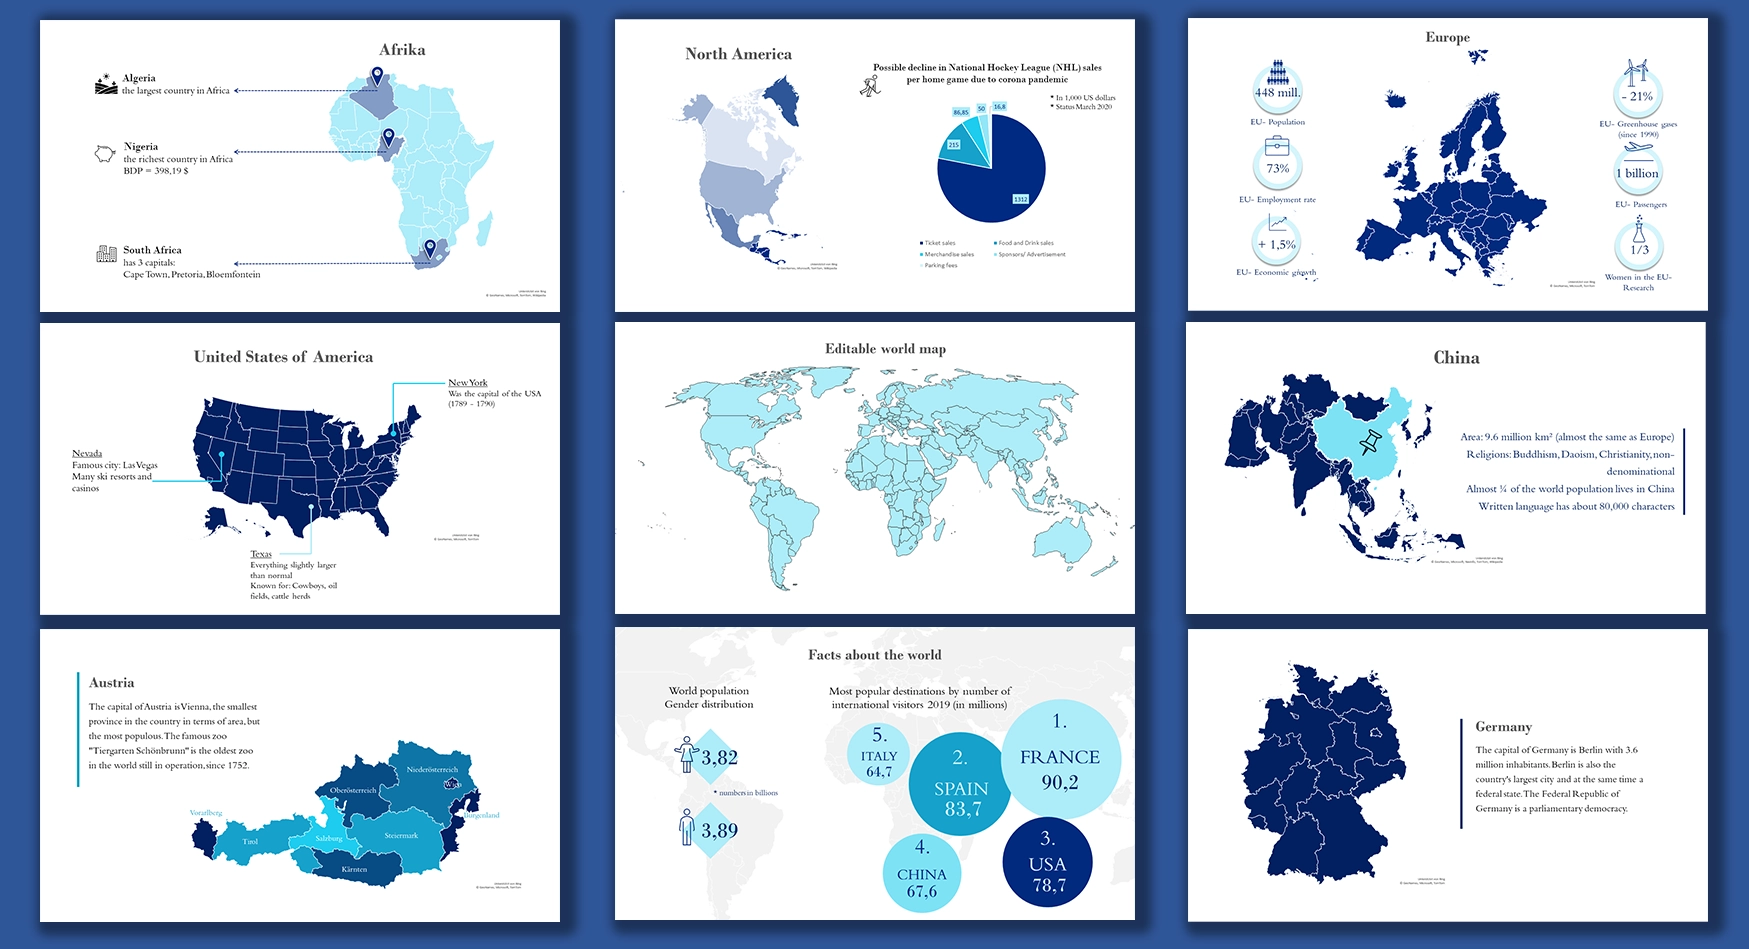
Exactly for that reason, we have prepared a complete PowerPoint filled with different world and country maps to
download. This template serves you mappings to use right away, but also shows you how to add text, pictogram's and
data to your presentation maps, in an interesting way.
Of course you can change any of those slides to your preferences by adjusting the colours, forms, layouts and so on.
Read our instruction to learn how to edit maps in PowerPoint.
Map chart are a relatively new feature of PowerPoint - it's only available since Office 2019 or Office 365!
If you also want to use your mappings in older versions of PowerPoint, the compatibility mode could be
a nice solution. Office offers this mode to make it easier to work with different versions of PowerPoint without
creating many problems.
Click here
to get more information on the official Microsoft site.
Our map template and finished PowerPoint:
- has editable mappings
- is free to use
- combines information and graphics on each slide
- is informative and clear
PowerPoint Maps Template:
Here we give you an instruction to edit the mappings of our PowerPoint template or create your own mappings for your presentation.
Insert maps
Recently PowerPoint created the feature of creating a map in the program itself. This tool is very powerful but since
it's quite new, some bugs occur from time to time.
Nevertheless, here is how you quickly add a map to your slides:
- Click in the menu bar on Insert > Chart.
- A window pops up. Select Map and click OK.
- PowerPoint creates a default world map and opens a table in which you can write any other country names and values. PowerPoint will automatically change the map as soon as you change values.
- When you are finished, click on the X of the Excel table to close it.
Attention! Until now, PowerPoint allows only 13 different countries. If you add more, they will get ignored. You can add names of continents, countries, regions and postcodes. - To re-open the Excel table and change anything later as well:
Right click on the map and choose "Edit Data" or click on the map and choose Chart Design > Edit Data in the menu ribbon.


Edit the layout of the map to your preferences
As said before, PowerPoint lets us choose between mapping the world or only a continent, focus on a country
or using postcodes to draw regions and areas.
Keep in mind, that combining different levels might not always work, for example when a city is too small to be seen
on a world map.
You can add, remove or change chart elements by selecting the map and clicking on the plus symbol in the right, upper corner. Here you can choose between showing the title, data labels or legend and on which position they should appear.

Moreover, you can use the Design and Format Tabs in the menu to get to the editing tools or double click onto the map. Pay attention on which part of graphic you click on, since the formatting task pane refers to exactly those objects. (Format Chart Area, Format Plot Area or Format Data Series)

To move the map, just click on it and drag it by the graphics border to your desired place.
To resize it: Click on its corners and move the mouse. (click Shift at the same time, to maintain the
graphics proportions)
PowerPoint offers numerous ways to edit your map, so play around with the tools to create your favourite graphic. For example, you can hide countries without a data value or change the map projection. (The proportions of world maps)

Select your favourite colours
Think about the colour scheme for your whole PowerPoint presentation. A specific scheme for all
slides makes the whole presentation easier to follow and your slides will perfectly harmonize together.
There are different ways to change your graphics colour depending on, if you want to include the data to your colour
plan or if you want to adjust each colour manually.
Use a default colour scheme:
- First, select your map
- Go to Design and click on Change Colours
- Here you can use any of those schemes which consider the inserted data and can go from the brightest to the darkest colour

Task pane: Format Data Series:
- Double click onto the map to open the Format Data Series menu
- Open the Series Colour tool and choose your minimum and maximum colour of decision

Individual colours:
- Select individual countries or parts (they have to be highlighted)
- Choose Fill and optionally Outline. You can also change the "weight" and "dashes"" of the outline
- If you click onto the maps background, you can also change the background colour of the map (makes sense for an island)

Fill all parts with the same colour
- If you have only one country, it makes sense to fill it with a single colour. This can be done with the method explained before (Individual colours) or by selecting your map and going to the chart menu Format > Shape Fill
- As before, you will find the same tools and options to change your objects, colour, outline or even effect (shadow,...)

With SlideLizard CREATOR, you can automatically update colours and images in all your presentations. Manage your slides in a central library and automatically synchronise slide changes with all your presentations. You can also organise your slides with tags and folders to find them as quickly as possible.
Tips for PowerPoint maps and charts
- Since you can only add 13 individual countries to a map, PPT quickly comes to its limits. Use Excel if you want to create more complex maps and copy the finished map to your slides.
- If you insert a country's name into the table, PPT ignores the lines between each states and draws only the large country. To add the lines, simply insert two federal- state names instead of the country's name and it will draw each single state.
- The feature of drawing maps is relatively new, PowerPoint sometimes has problems to draw the map. You might
have to delete a graphic and start again but the result will pay, so don't give up!
Save your project from time to time to avoid the loss of a lot of work.

Our advanced map with even more options
Last but not least, we present you a map for advanced PPT- mapping- users. You can find this map on the last slide
of our downloadable PowerPoint presentation. This graphic is an SVG- file, which means that
you can grab and move
each country of the world map to any place you want.
Moreover, you can change it's colour again (the same way as before) and delete or resize them as well.

If you want to find a specific country or make some objects unseen, there's an easy way to do so:
- Go to the Home > Drawing menu and click on Arrange
- Select the last option Selection Pane
- A tool bar will pop up. Here you can click on the right "eye" symbols to hide or un-hide one of the countries.

That was it! Have a lot of fun at creating your map or using our finished ones!
FAQ
How can I insert maps in PowerPoint?
With the help of PowerPoints map function you can create maps directly in PowerPoint and edit them as you like. We have created some country and world map templates which you can download here for free. You can read here everything around maps in PowerPoint.


