- Contents
1. Download a free Template
Creating your own flowchart in PowerPoint is a little bit of work. But if you are in a hurry or simply not in a creative mood, you can download on of the following templates we designed specially for you. If you want, you can of course modify and adjust them
to your needs (e.g. remove or add branches and boxes).
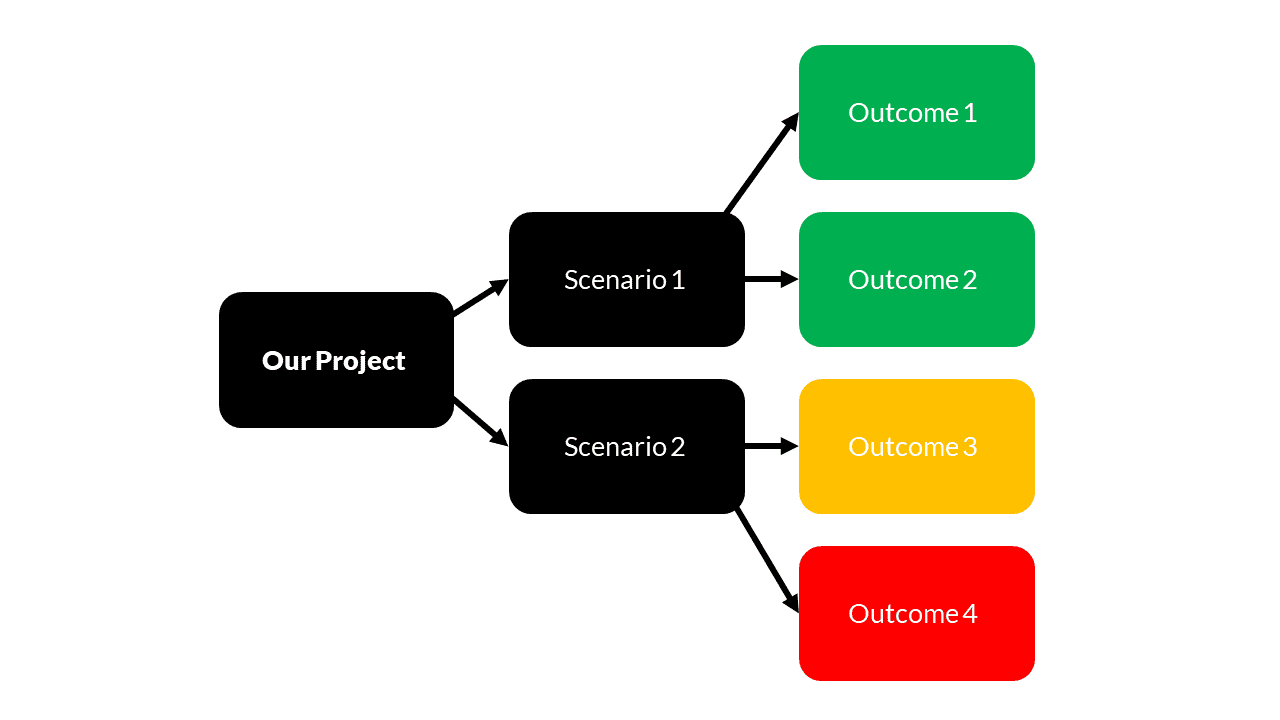
Project flowchart PowerPoint template
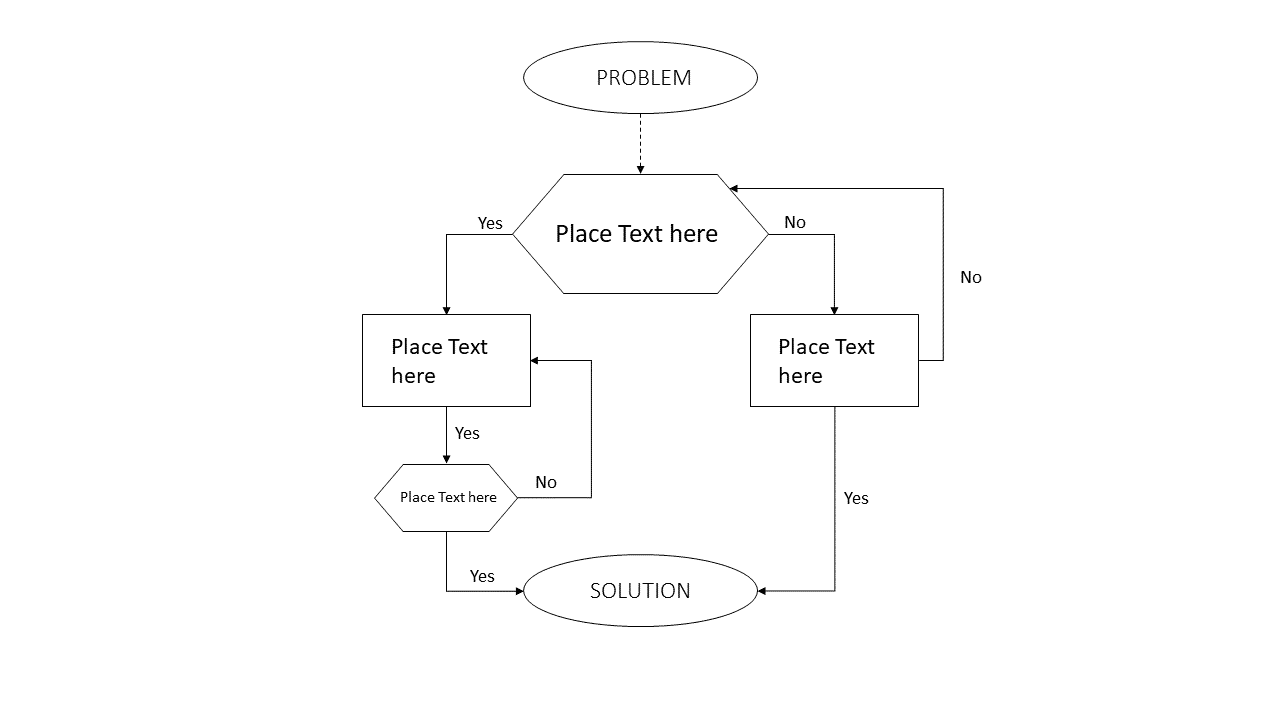
Basic flowchart PowerPoint template
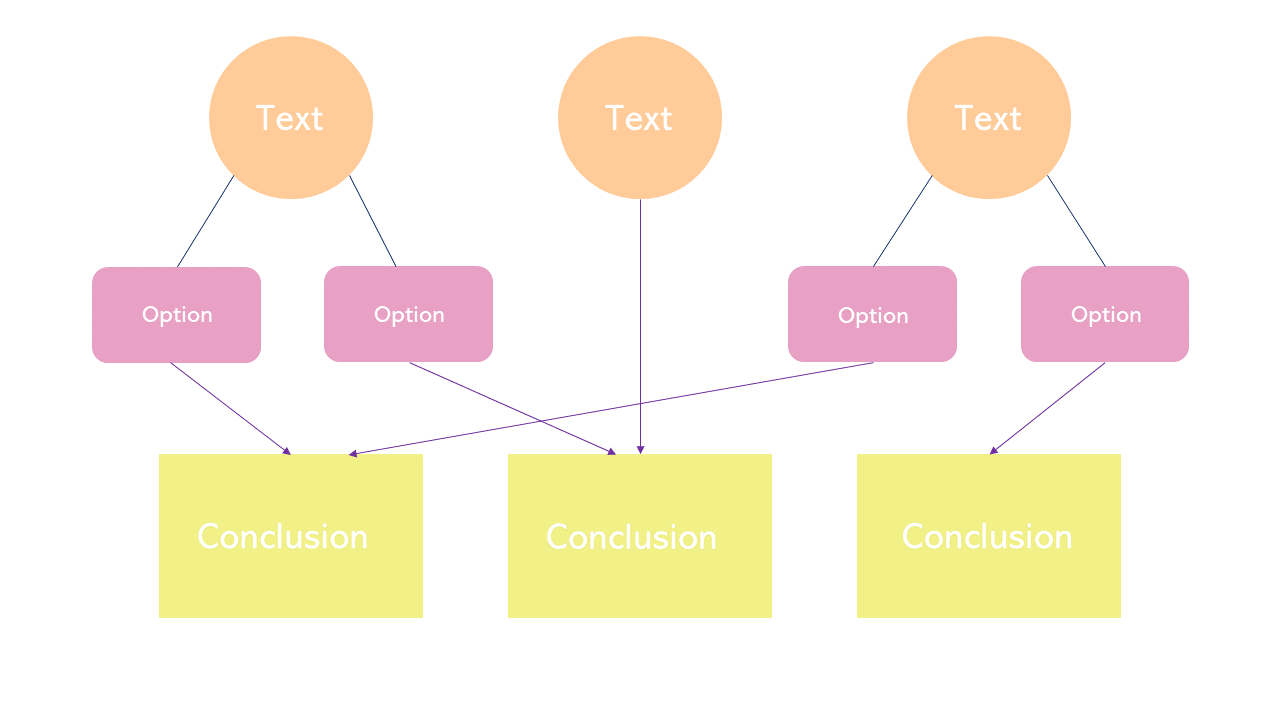
Pastel decision tree PowerPoint template
2. Create a Flowchart or Decision Tree on your own
As mentioned before, you can create your own individual flowchart by following a few steps. Here’s how to do it:
1. Plan your diagram
This might sound strange or even boring, but is in fact extremely helpful and saves a lot of time. Before you even start, take a minute to think about your diagram and plan it out: If it is just a small one with only a few branches, it’s usually enough to visualize it in your head before starting to draw it in PowerPoint. If you have a more complicated flowchart however, with many branches and possible results, I strongly recommend creating a quick sketch with a pen on paper to make sure you have a clear image of what you want your diagram to show.
2. Choose and place your boxes
Once you know exactly how your decision tree should look like, it’s time to open up PowerPoint and start creating shapes! To do so, go to the “Insert” tab and choose the shape you want your boxes to have. In our tutorial, we used the rectangle with round corners, but feel free to use any shape you want.
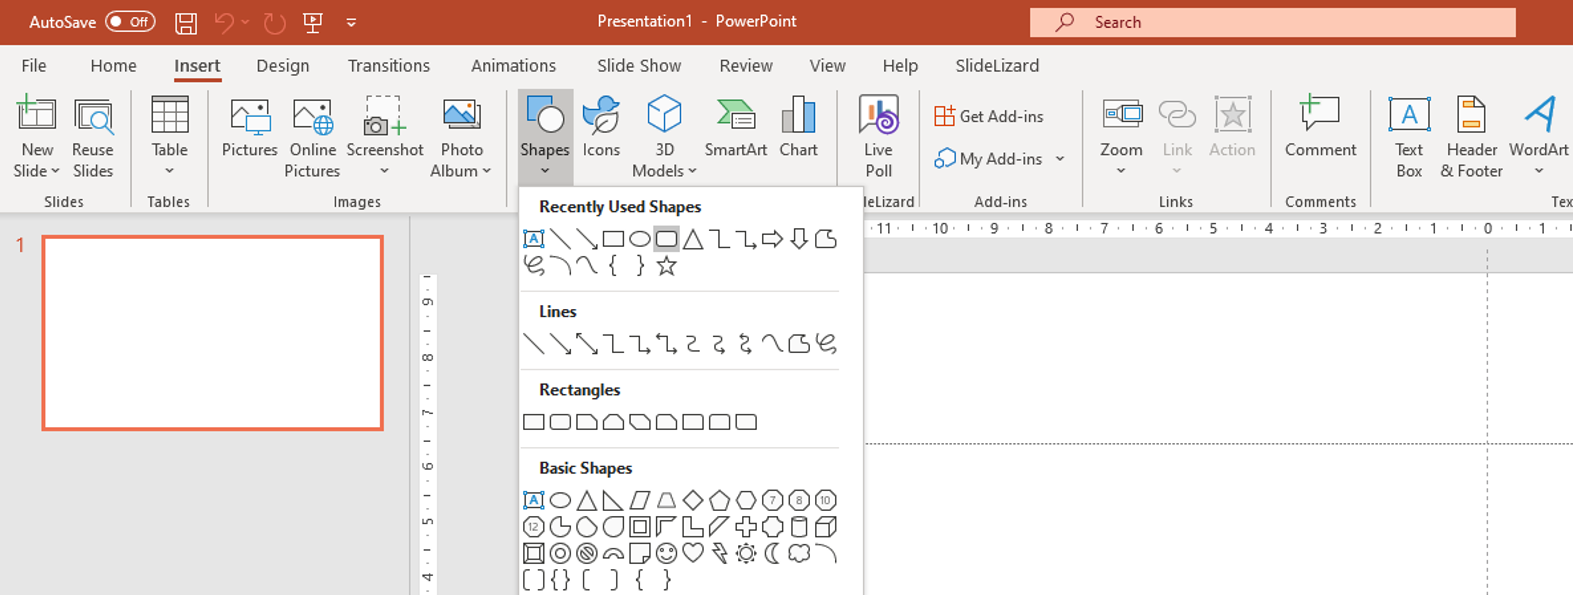
Draw the first shape and adjust it as you like. You can change the size (by dragging on the sides/edges) and the design in the Shape Format tab.
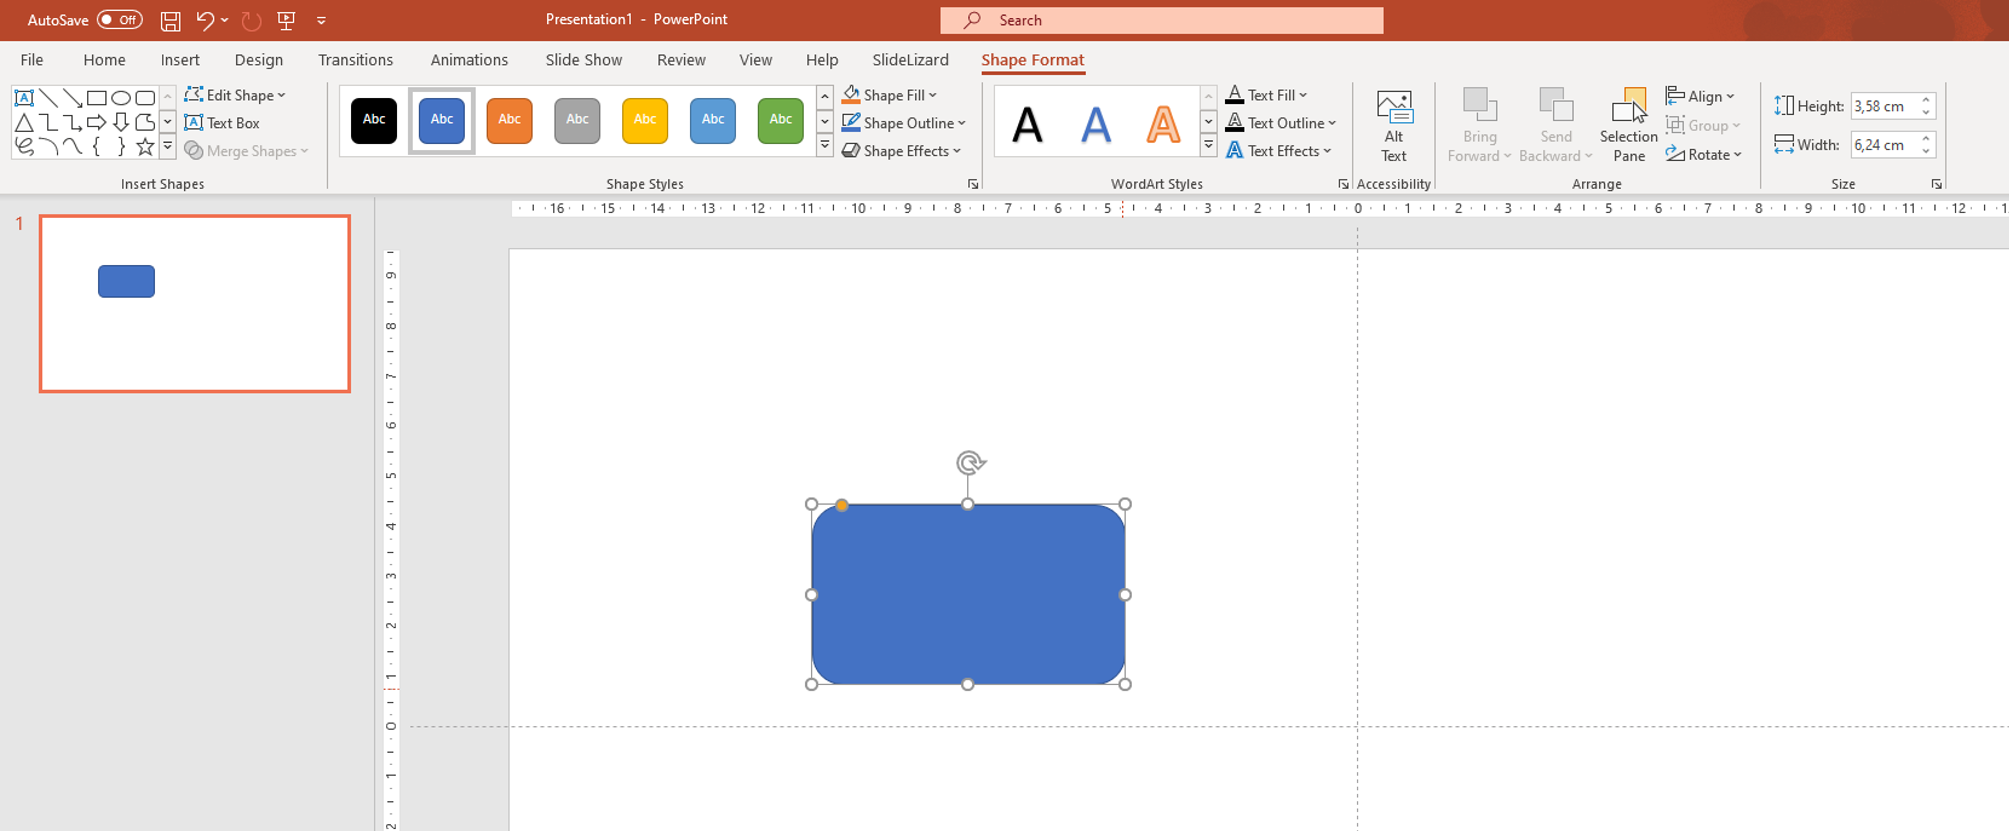
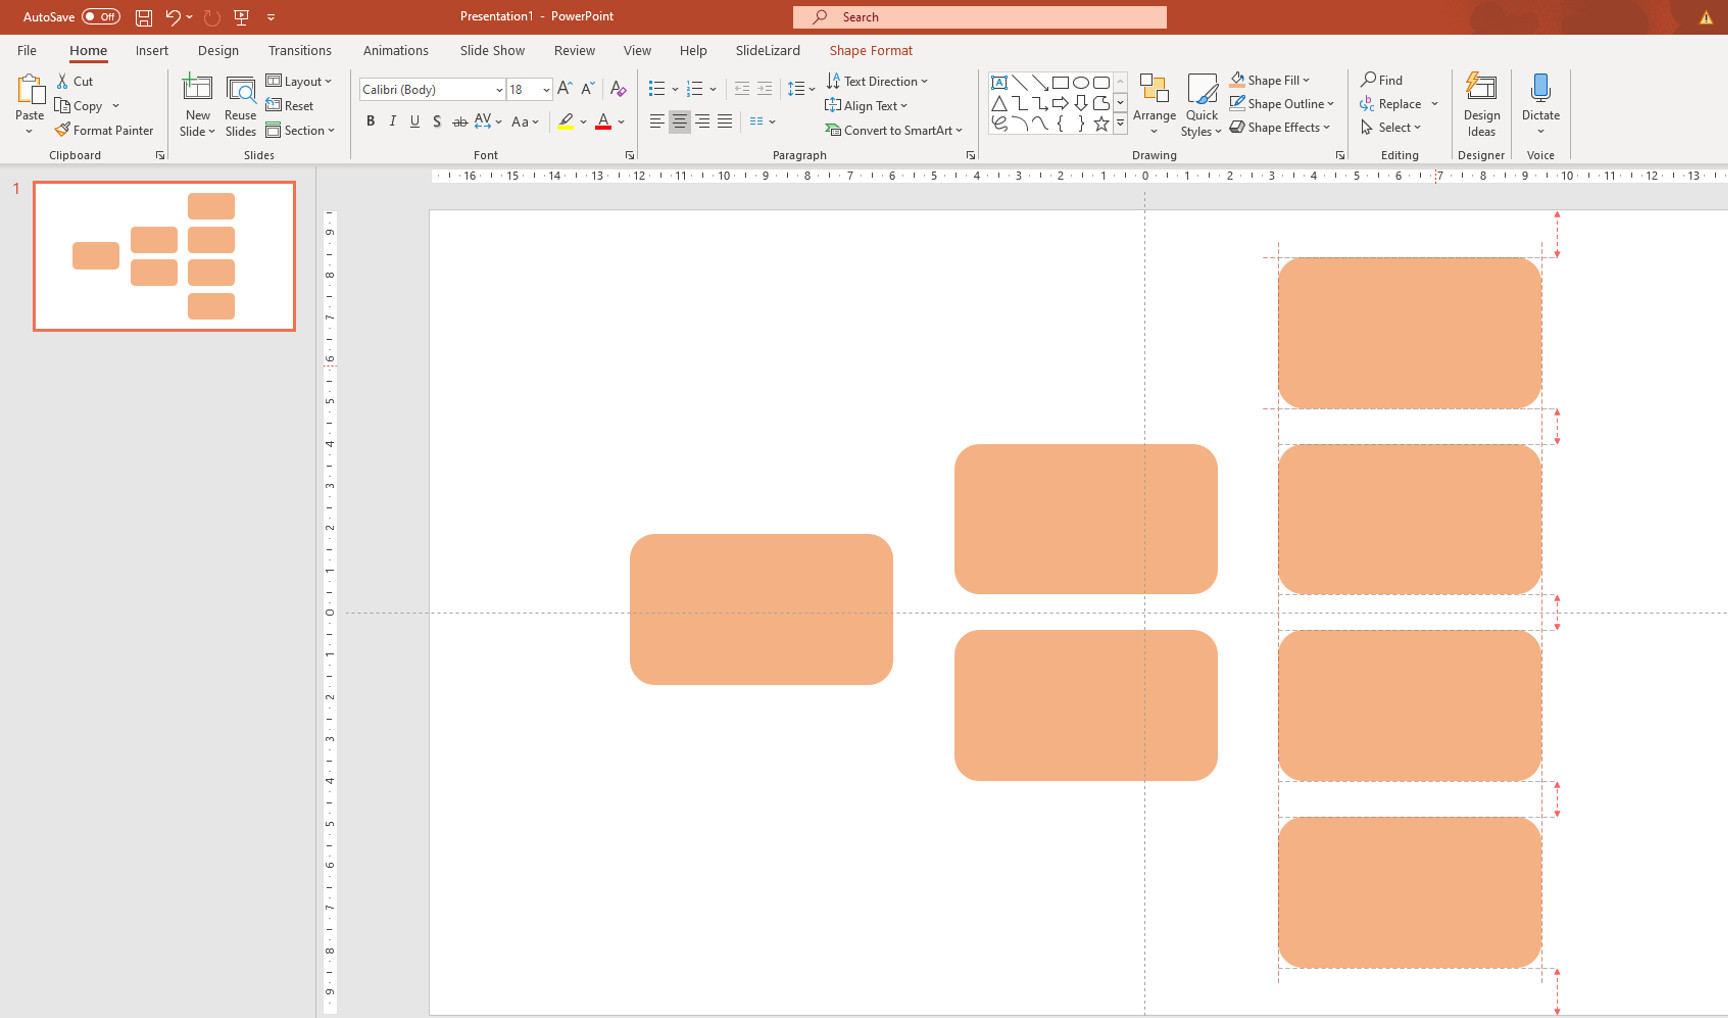
Once you’re satisfied with your base shape, copy it by selecting it and then pressing either CTRL+C or right click > Copy. By pressing either CTRL+V or right click > Paste, you can paste the shape to your slide. Do this until you have the amount of shapes you need for your flowchart. (In our example, that would be 7 times).Align your boxes. Drag them where you want them to be placed. PowerPoint helps you with the symmetry by showing the spacing between objects.
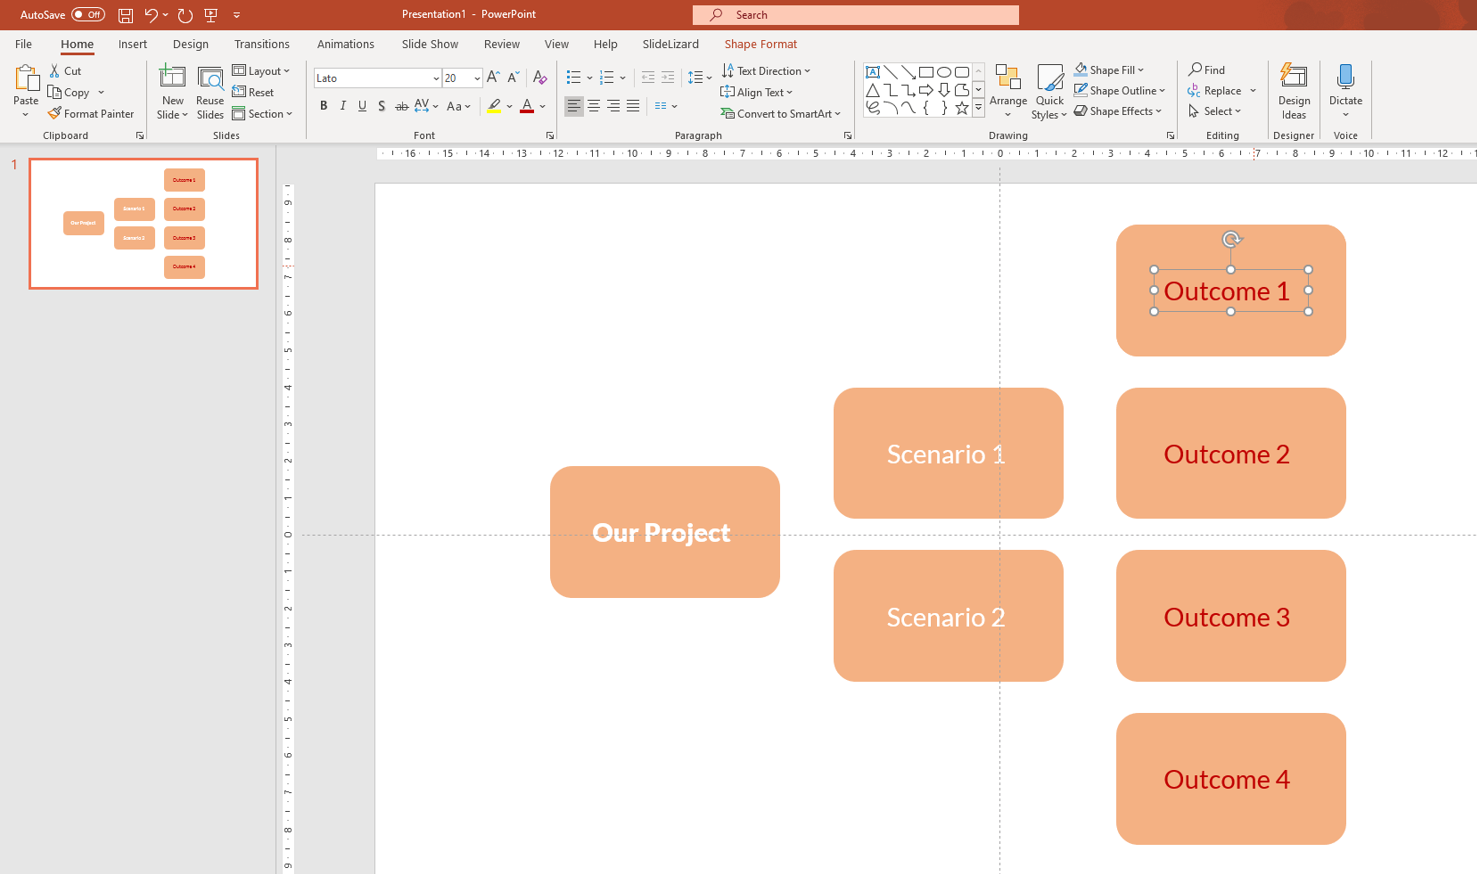
Now, put text boxes into the shapes. You can do so by going to the Insert tab again and then clicking “Text Box”. Draw it on your slide and place it directly over one of your created shapes. You can of course change the font size and style. Once you typed in your first text, you can simply copy that text box, paste it as often as you need and place it over the shapes.
Place the branches
Now the only thing that’s left to do is to connect the boxes with the branches. Again, go to Insert > Shapes and choose the shape you want. I recommend using arrows or simple lines. Draw it on your slide (between the boxes you want to connect).
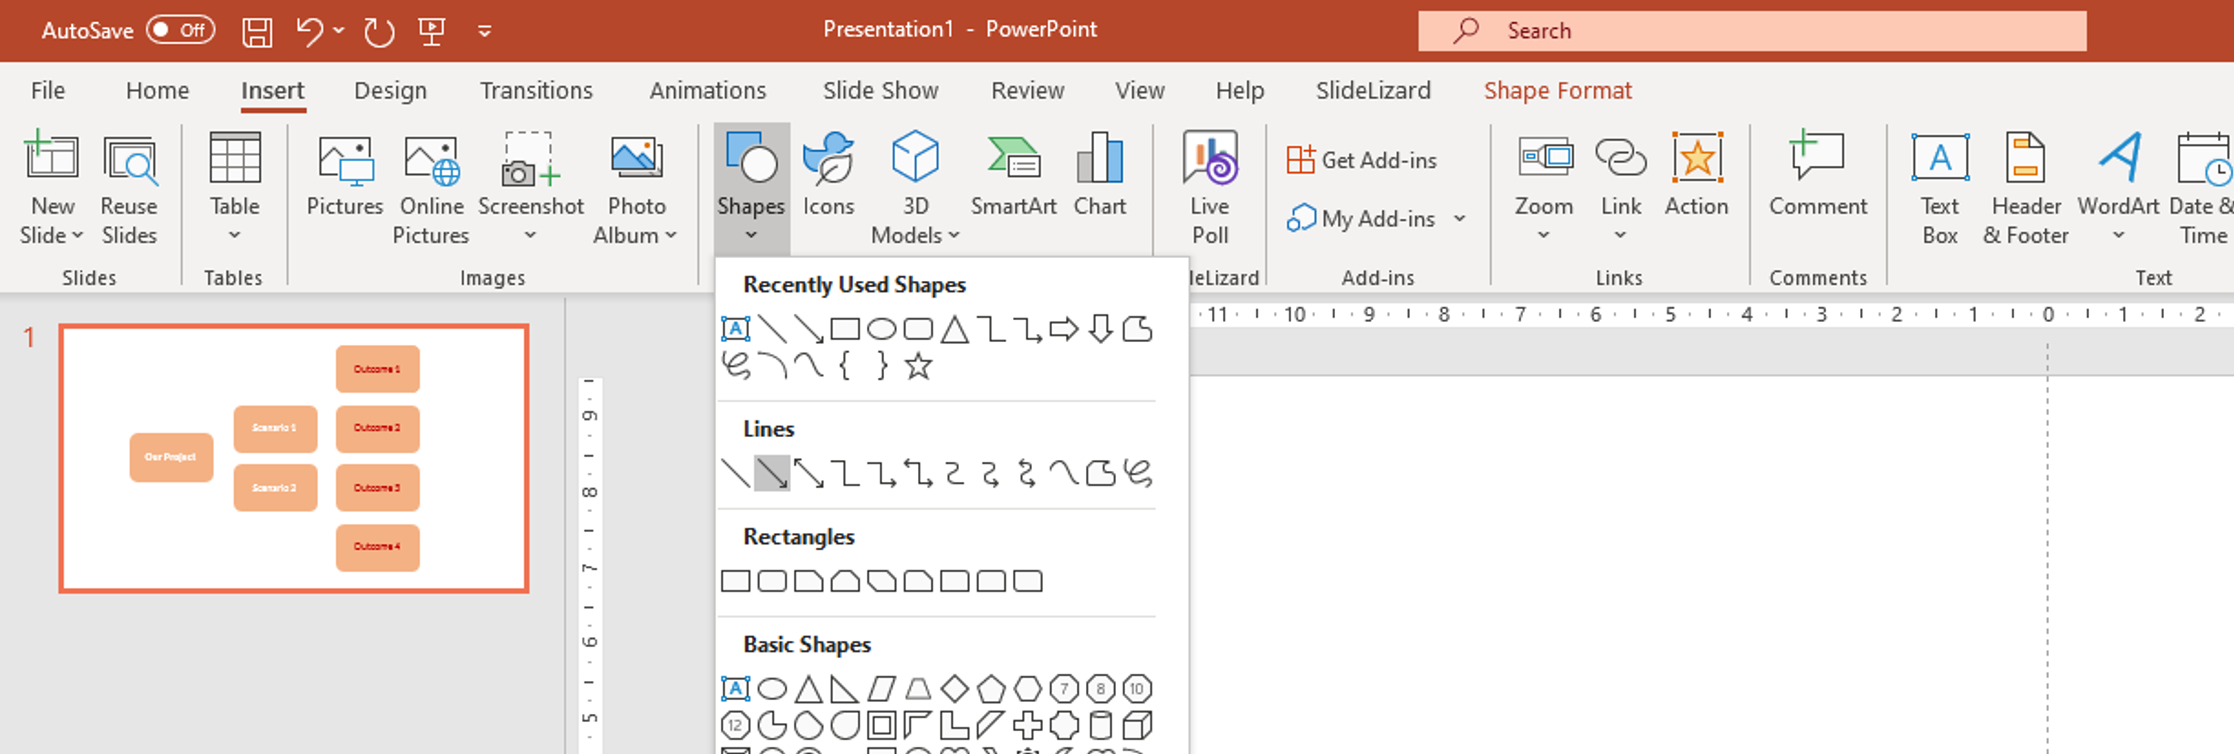
Repeat that for all the boxes. Connect them with branches according to the sketch you made before. If the lines are on top of the boxes like shown below, that doesn’t matter – we’ll fix that in a minute.
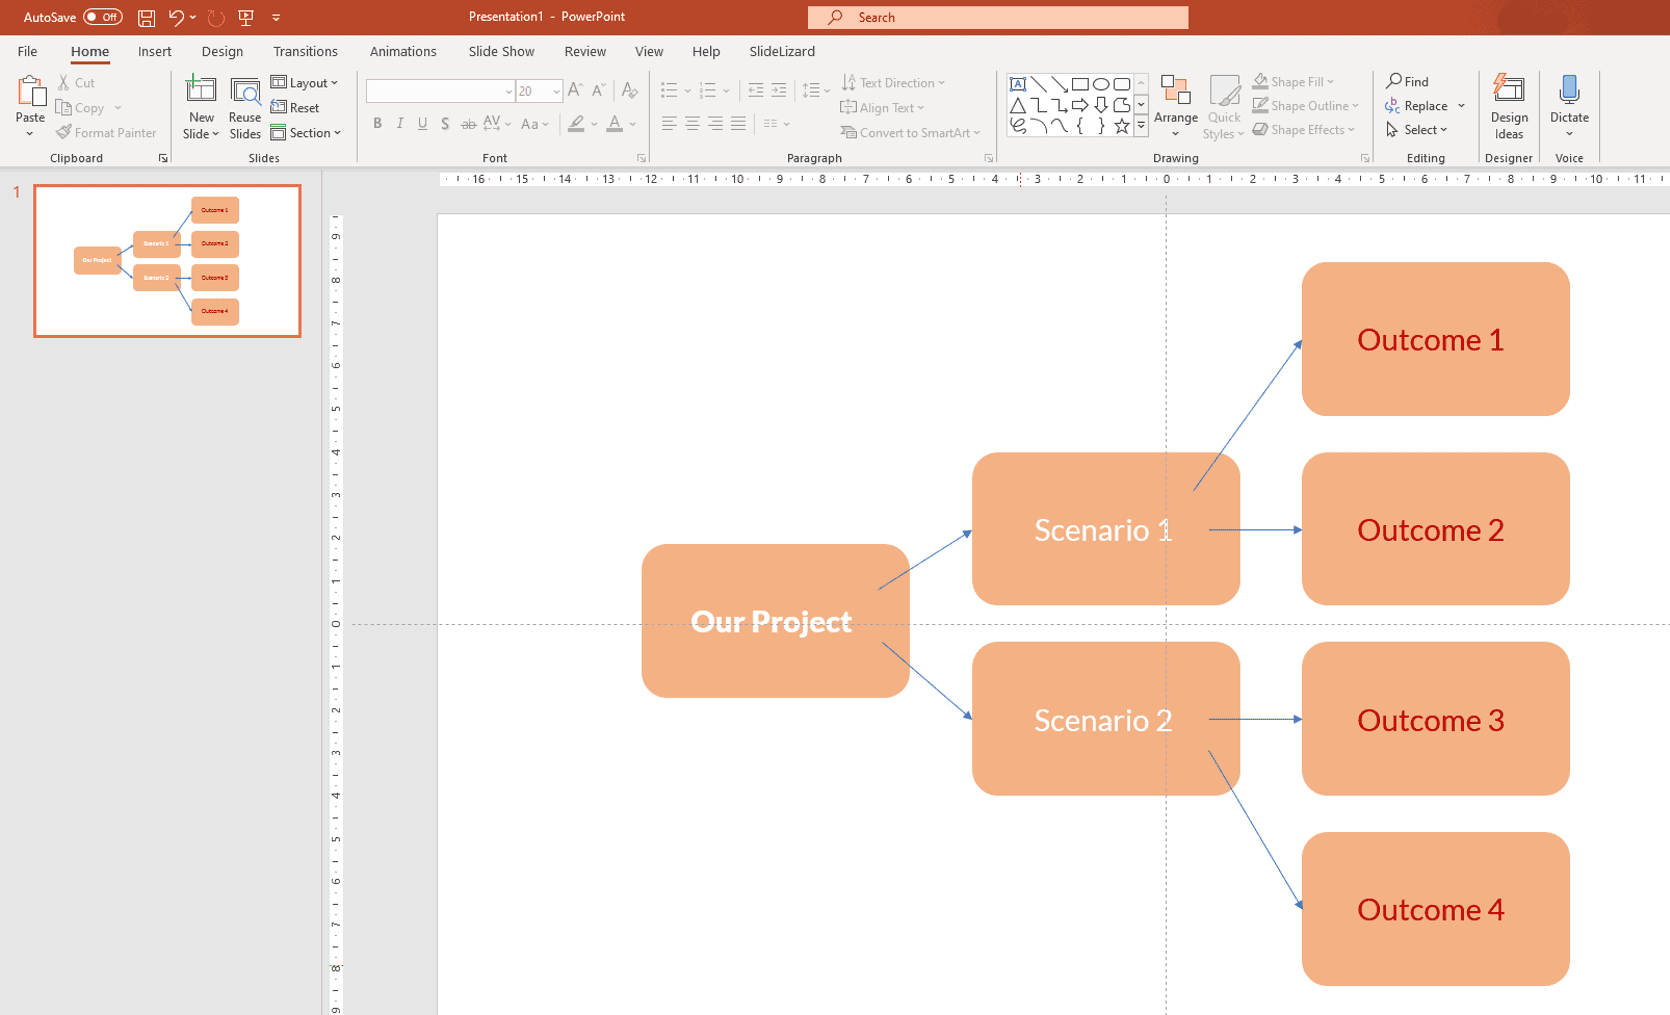
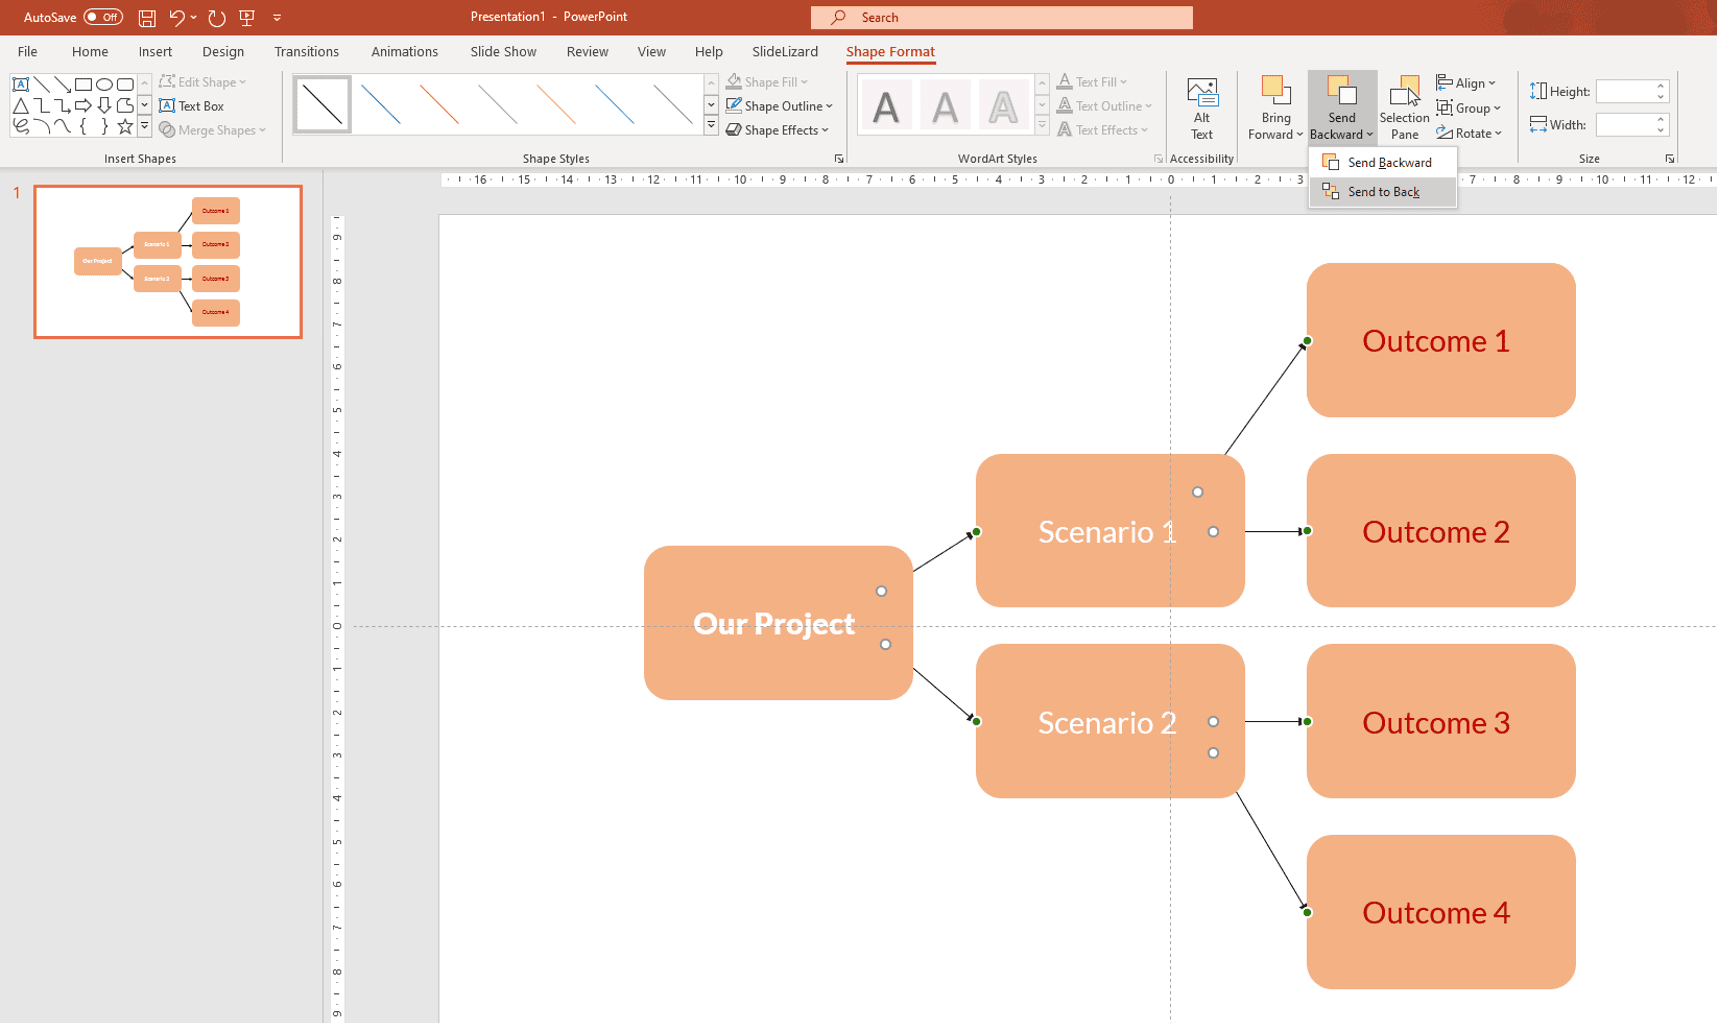
Once your branches are in place, it is time to select them all. Do so by clicking on each one individually while holding CTRL. The, go to the Shape Format Tab, Click Send Backward > Send to back. Your branches should now be behind the boxes. You can also format the branches by selecting a different shape fill and/or outline.
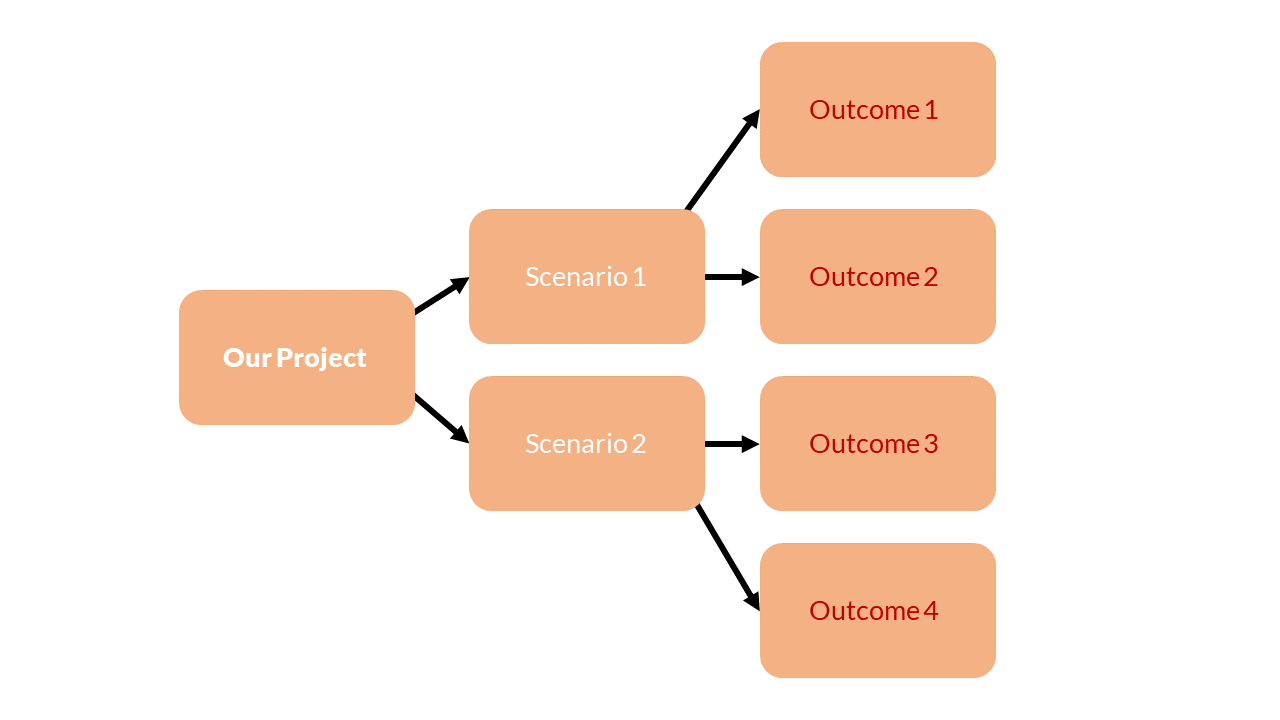
Make any last adjustments (e.g. rearranging the arrows,…) until you’re satisfied with the result.
Use the SlideLizard CREATOR to manage the slides of your presentation via a central library. With just one click, you can change colours, images or logos in all your presentations. This way, everyone can always present the most up-to-date version. In addition, the global search allows you to find slides as quickly as possible across the company.
3. Useful Keyboard Shortcuts
| Shortcut | Action |
|---|---|
| CTRL + C | Copy an element or text |
| CTRL + V | Paste a previously copied element or text |
| CTRL + Z | Undo an action |
| CTRL + Y | Redo an action |
FAQ
How do I create a flowchart in PowerPoint?
First plan how your flowchart should look. Then select the shape you want your boxes to have in the "Insert" tab in PowerPoint. Draw the first shape and then copy it as many times as you need it. Place them and then put text boxes into the shapes. After that, you only have to connect the boxes with branches by selecting a suitable shape for them again. In our blog you can find a more detailed tutorial on how to create flowcharts.
Where can I download templates for a flowchart in PowerPoint?
We have created some flowchart templates in PowerPoint, which you can download and use for free here.

