Arrows can be easily created in PowerPoint. They help to direct the focus of the presentation participants in a certain direction and can highlight elements. There are no limits to creativity with arrows – whether you're visualizing process flows with arrows or depicting a movement. With arrows you bring movement into every presentation.
-
Content
1. Arrrows as infographics
Arrows are valuable infographics that are mainly used to visualize processes. Simple arrows indicate a clear direction and guide presentation participants in a reading direction. In addition, arrows can represent dependencies. This avoids listeners having to search for connections for a long time and connections are quickly and clearly recognizable.
2. Insert arrows in PowerPoint
Arrows can be easily created in PowerPoint.
-
Click on Insert and Shapes. Select the arrow you want. In
PowerPoint there are block arrows and line arrows to choose from.
![Choose arrow shape]()
-
Click on the place where the arrow needs to be inserted. Hold the left mouse
and drag the arrow to the desired size.
![Insert shape]()
-
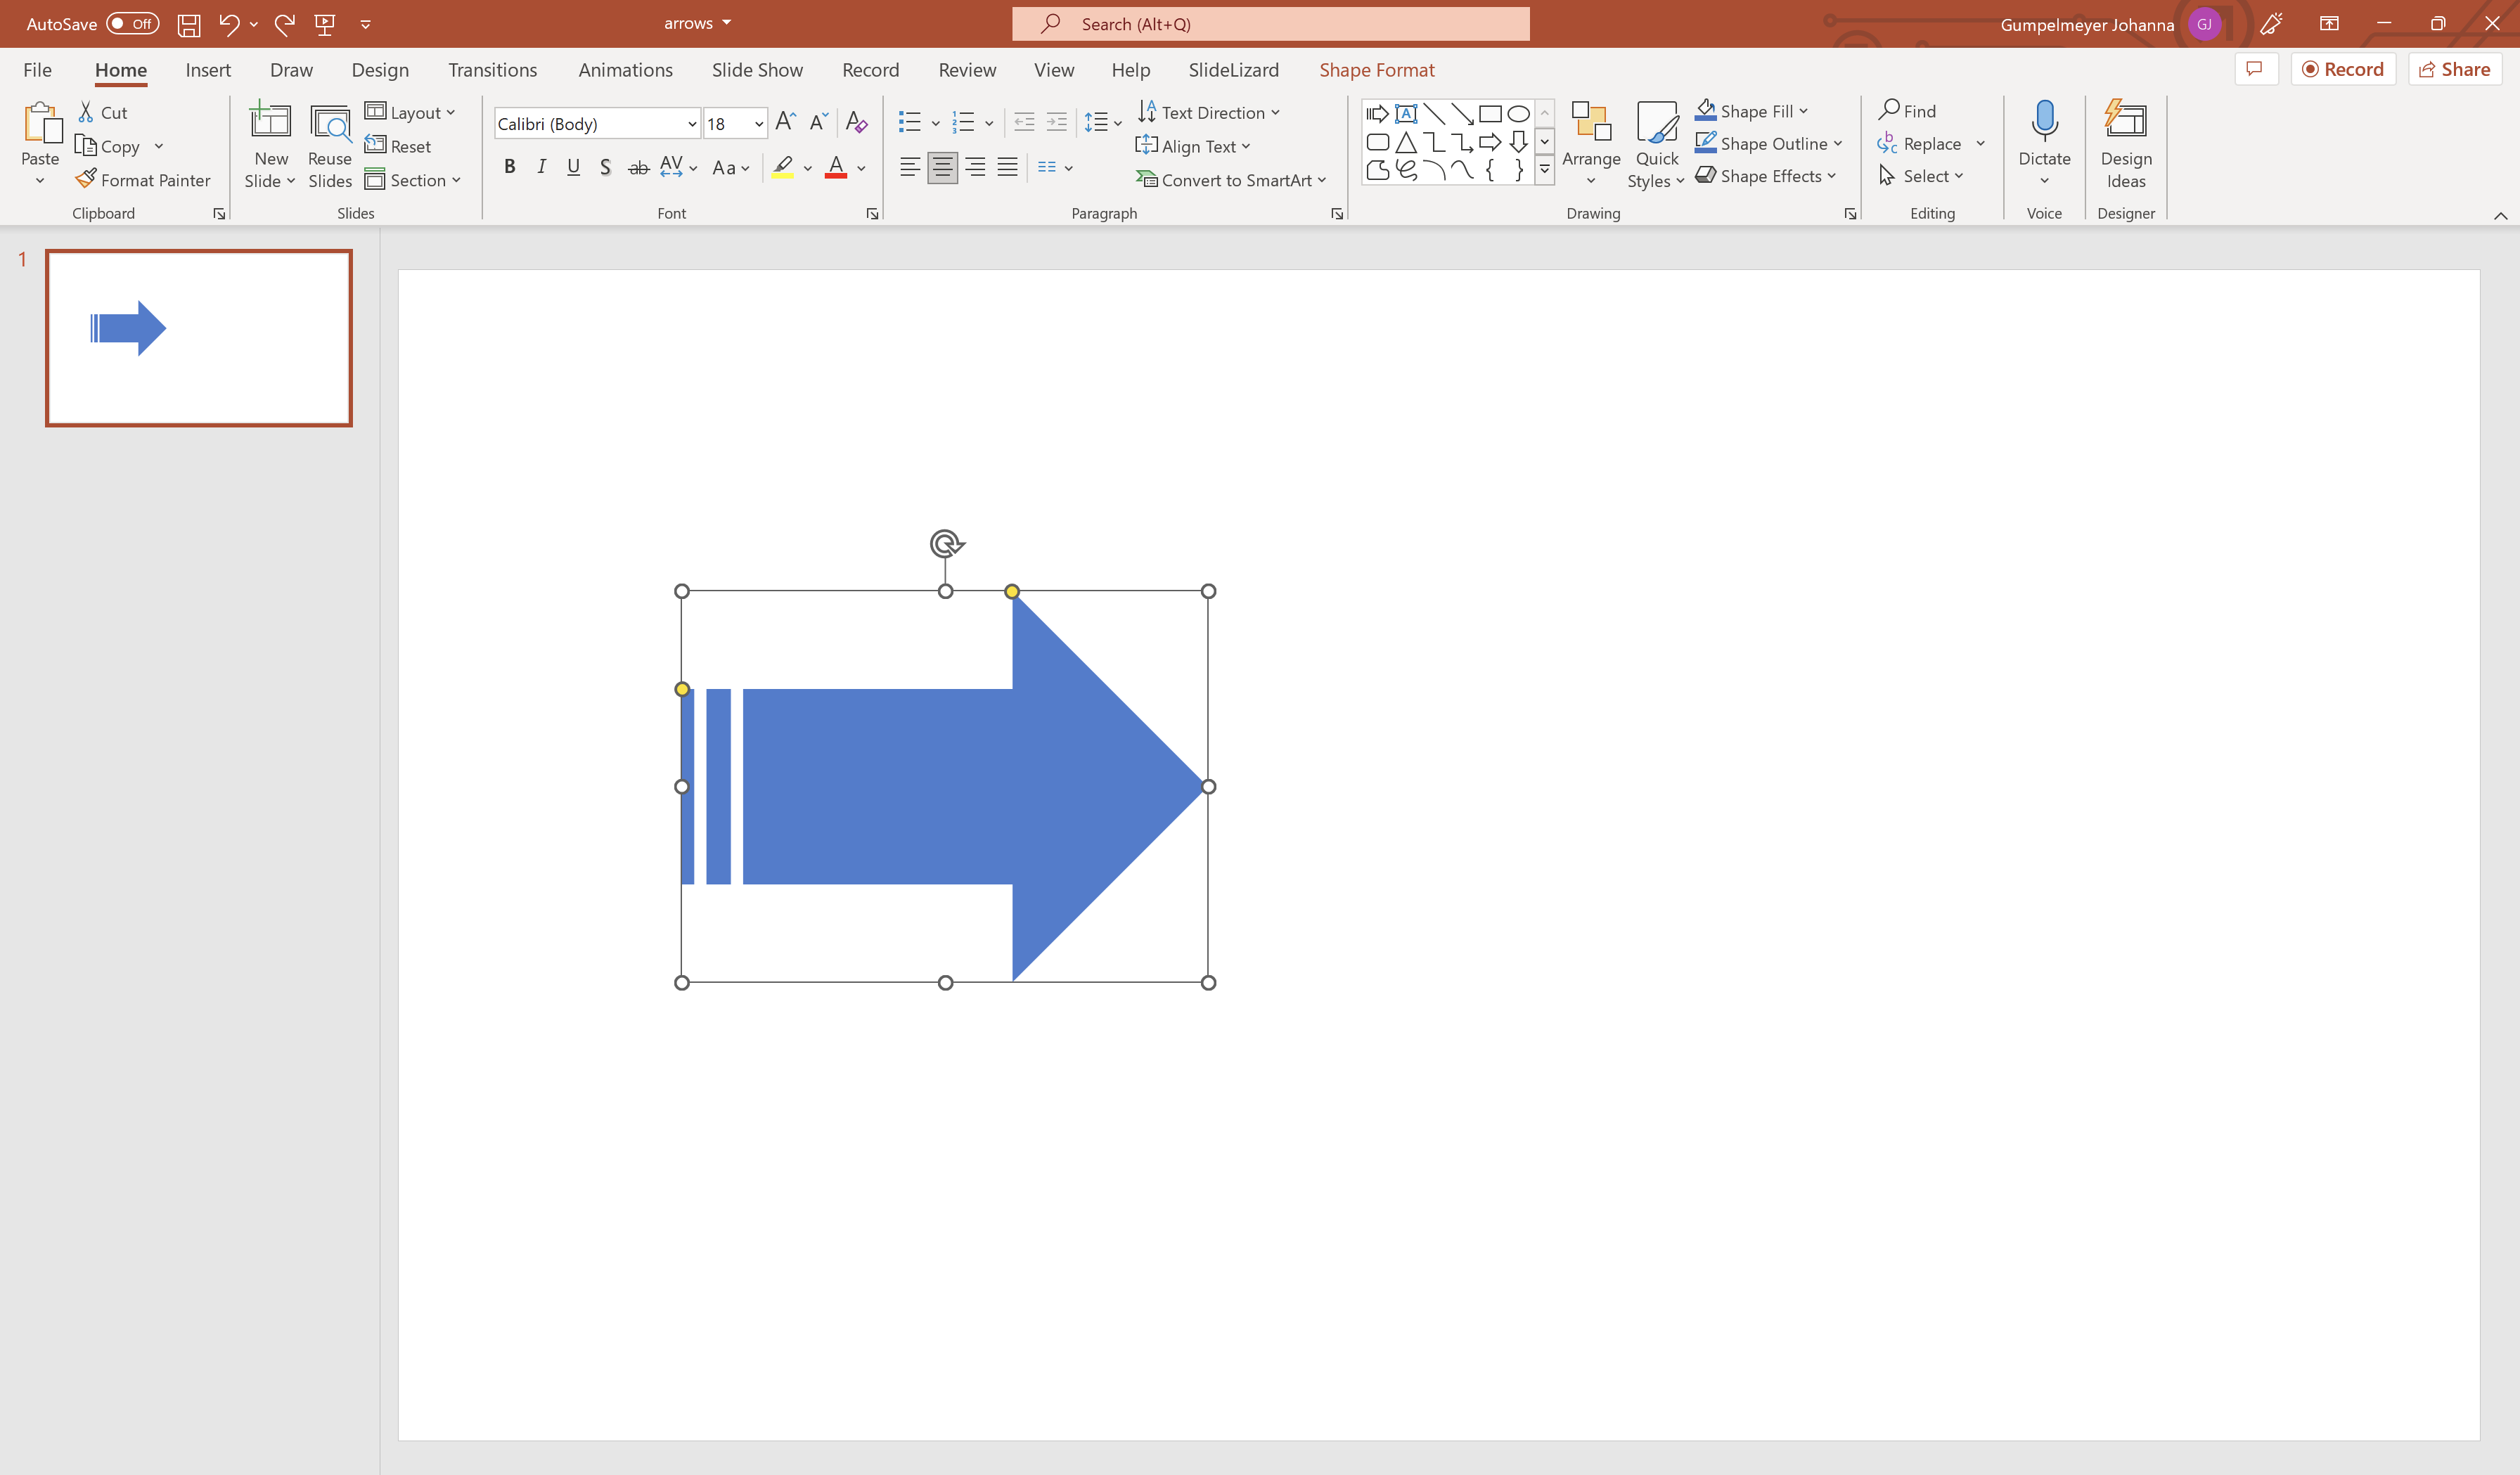
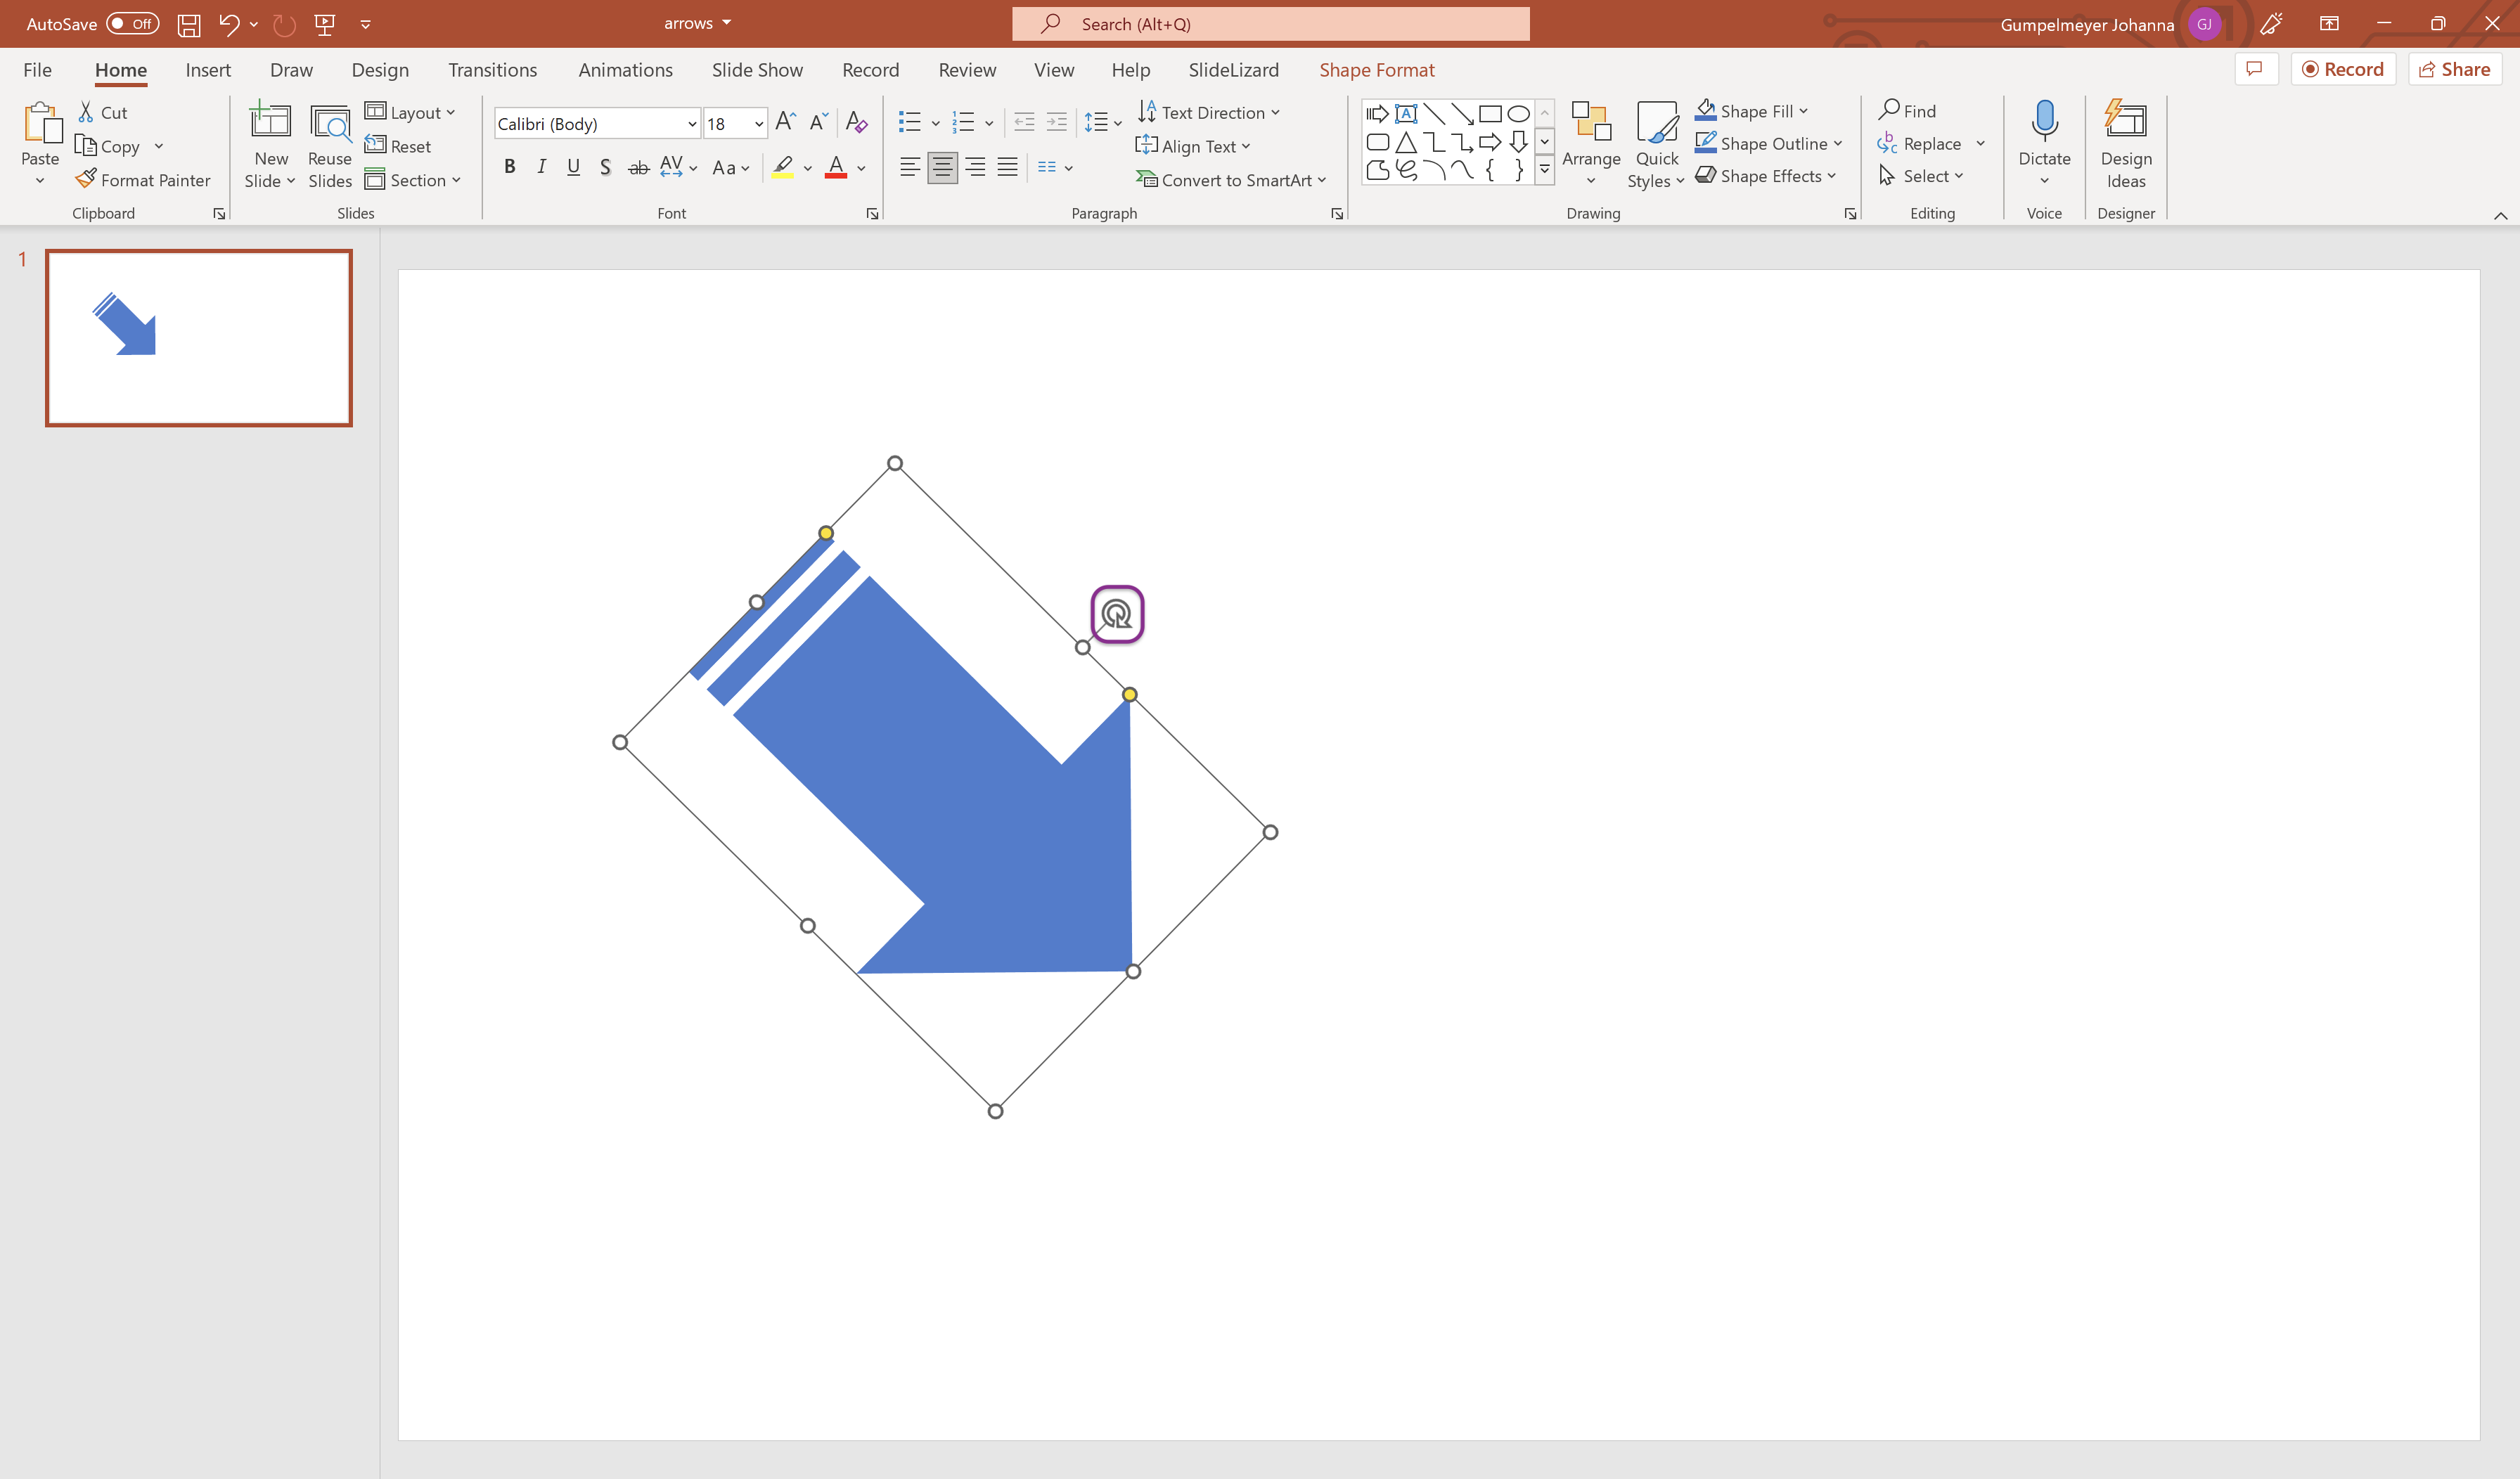
To rotate the arrow, click on the circle symbol in the centre and rotate the
arrow to the left or right while pressing the mouse button.
![Rotate arrow]()
3. Edit arrows in PowerPoint
Once you have inserted the arrow you want, there are some additional settings that can be made. From drop shadows to light effects, everything is possible in PowerPoint.
-
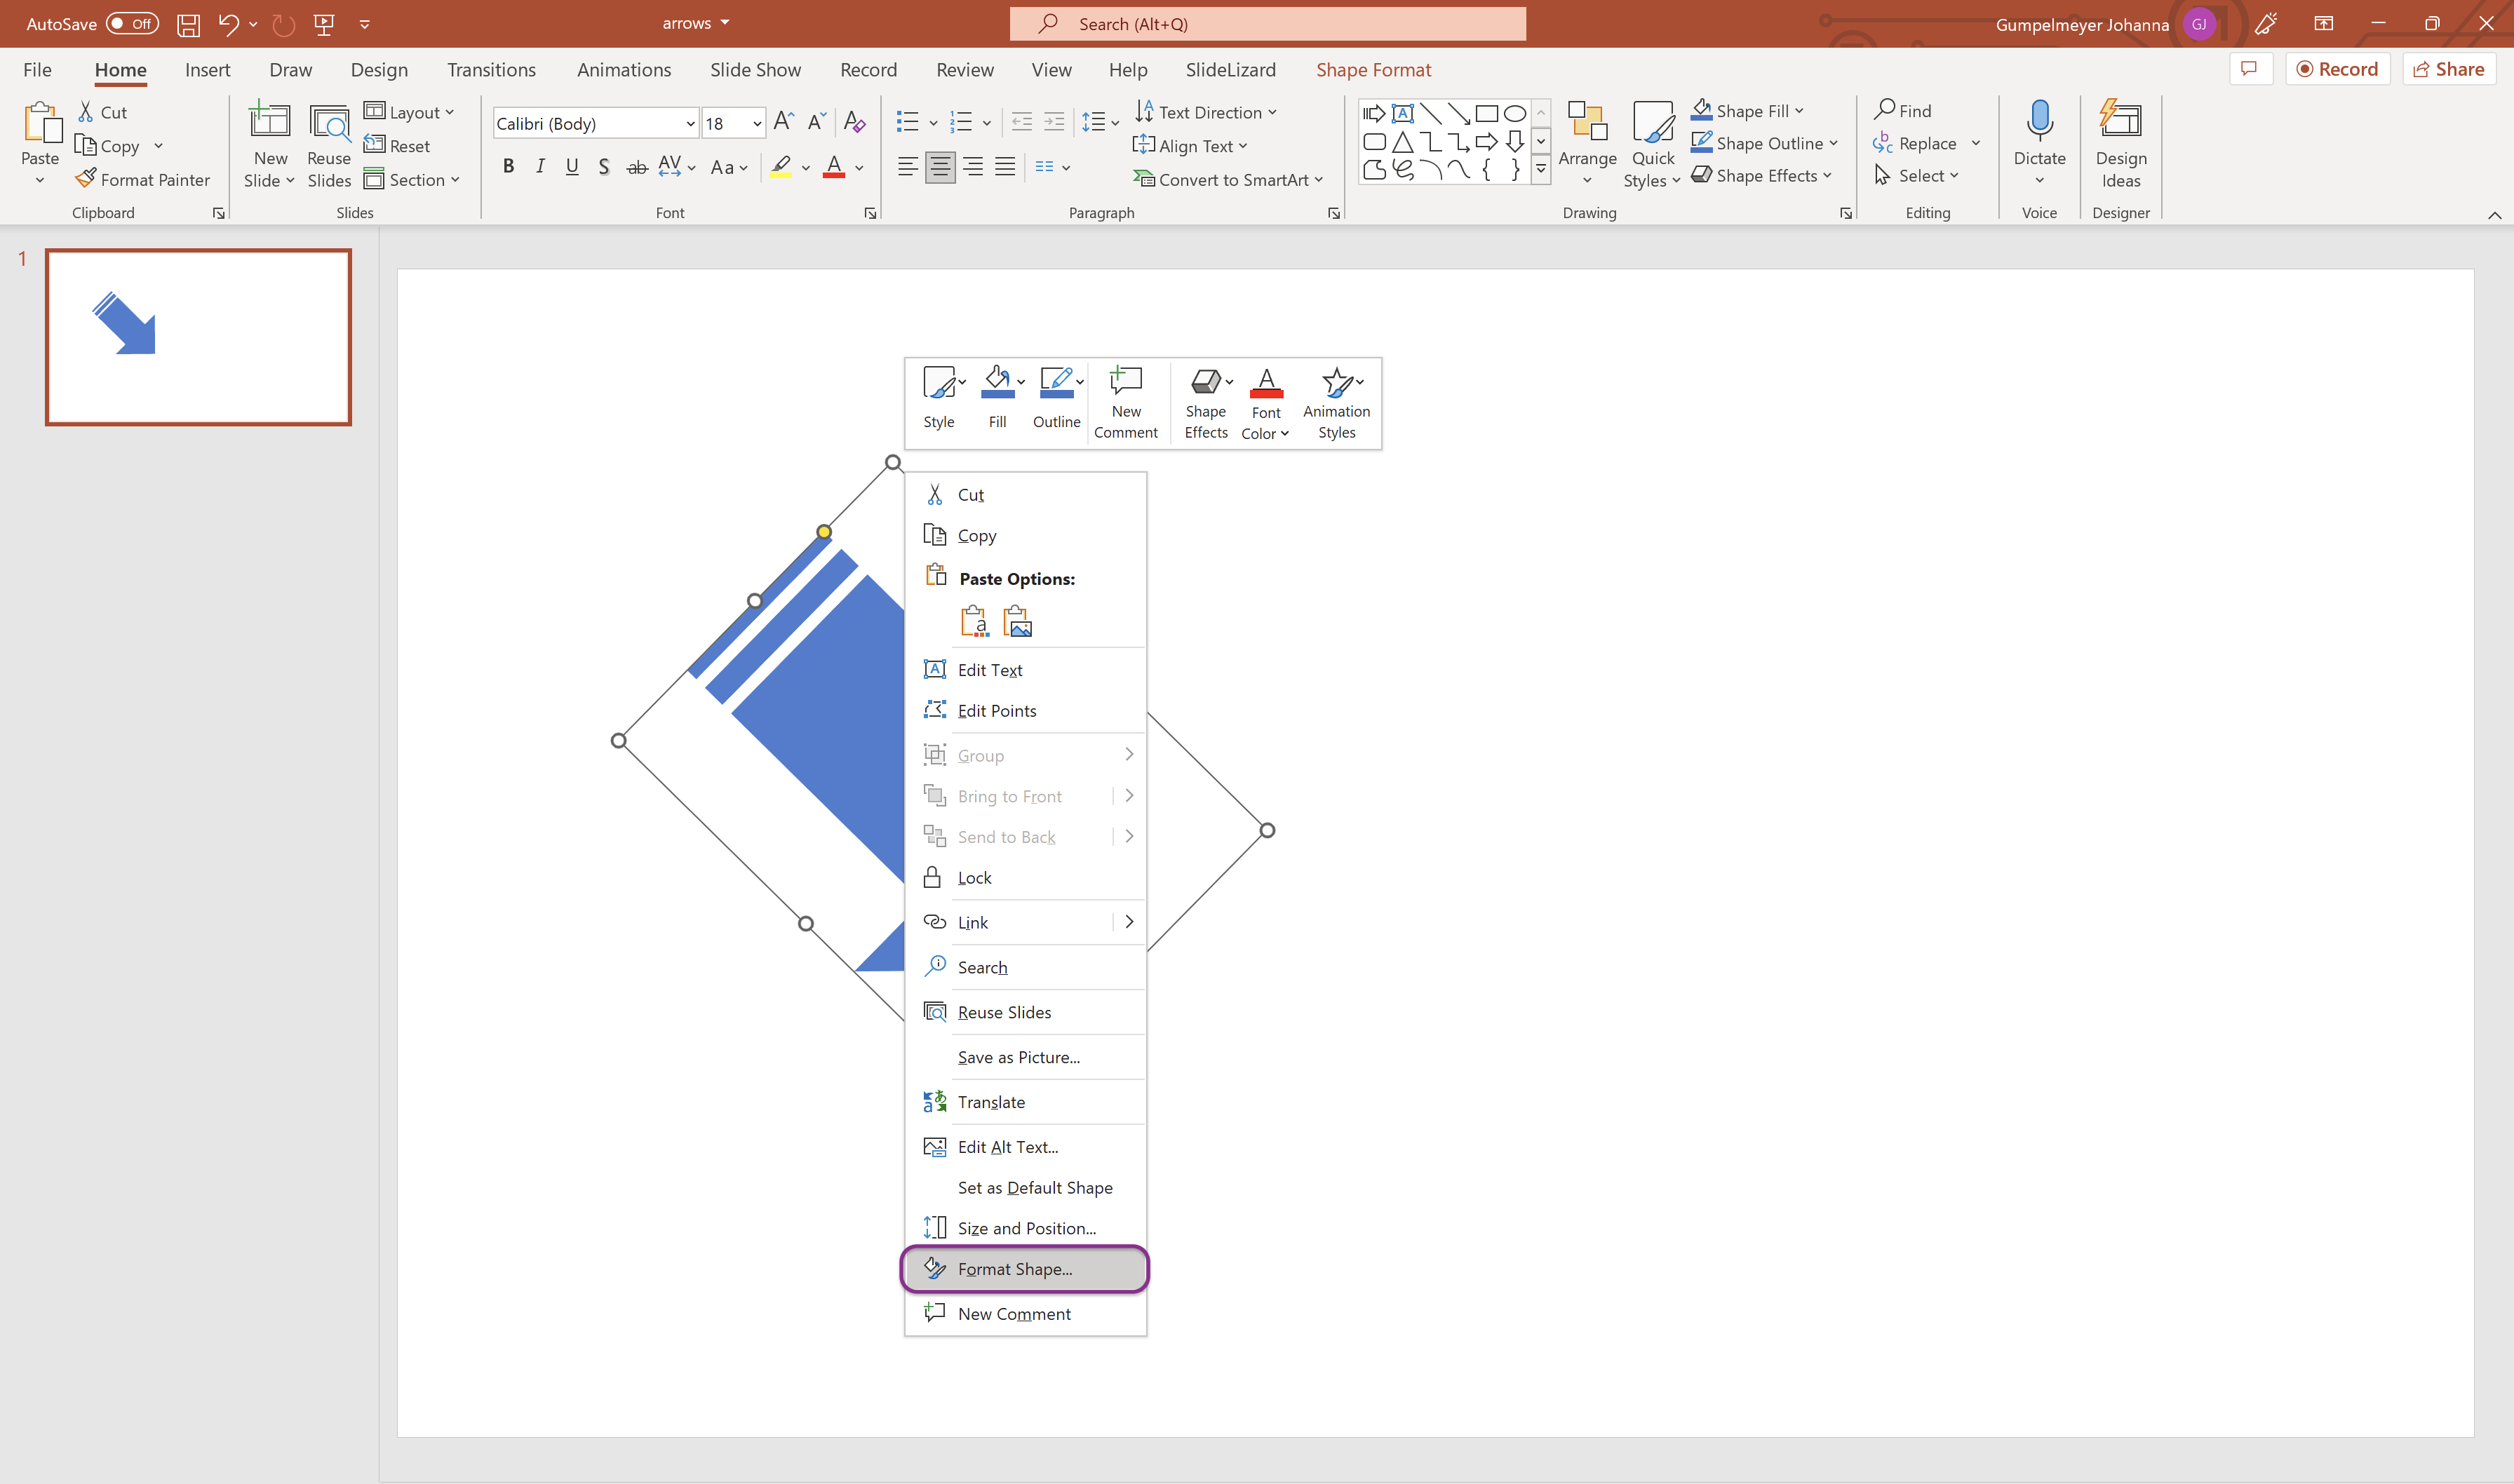
To do this, right click on the arrow and select Format shape.
![Format shape]()
-
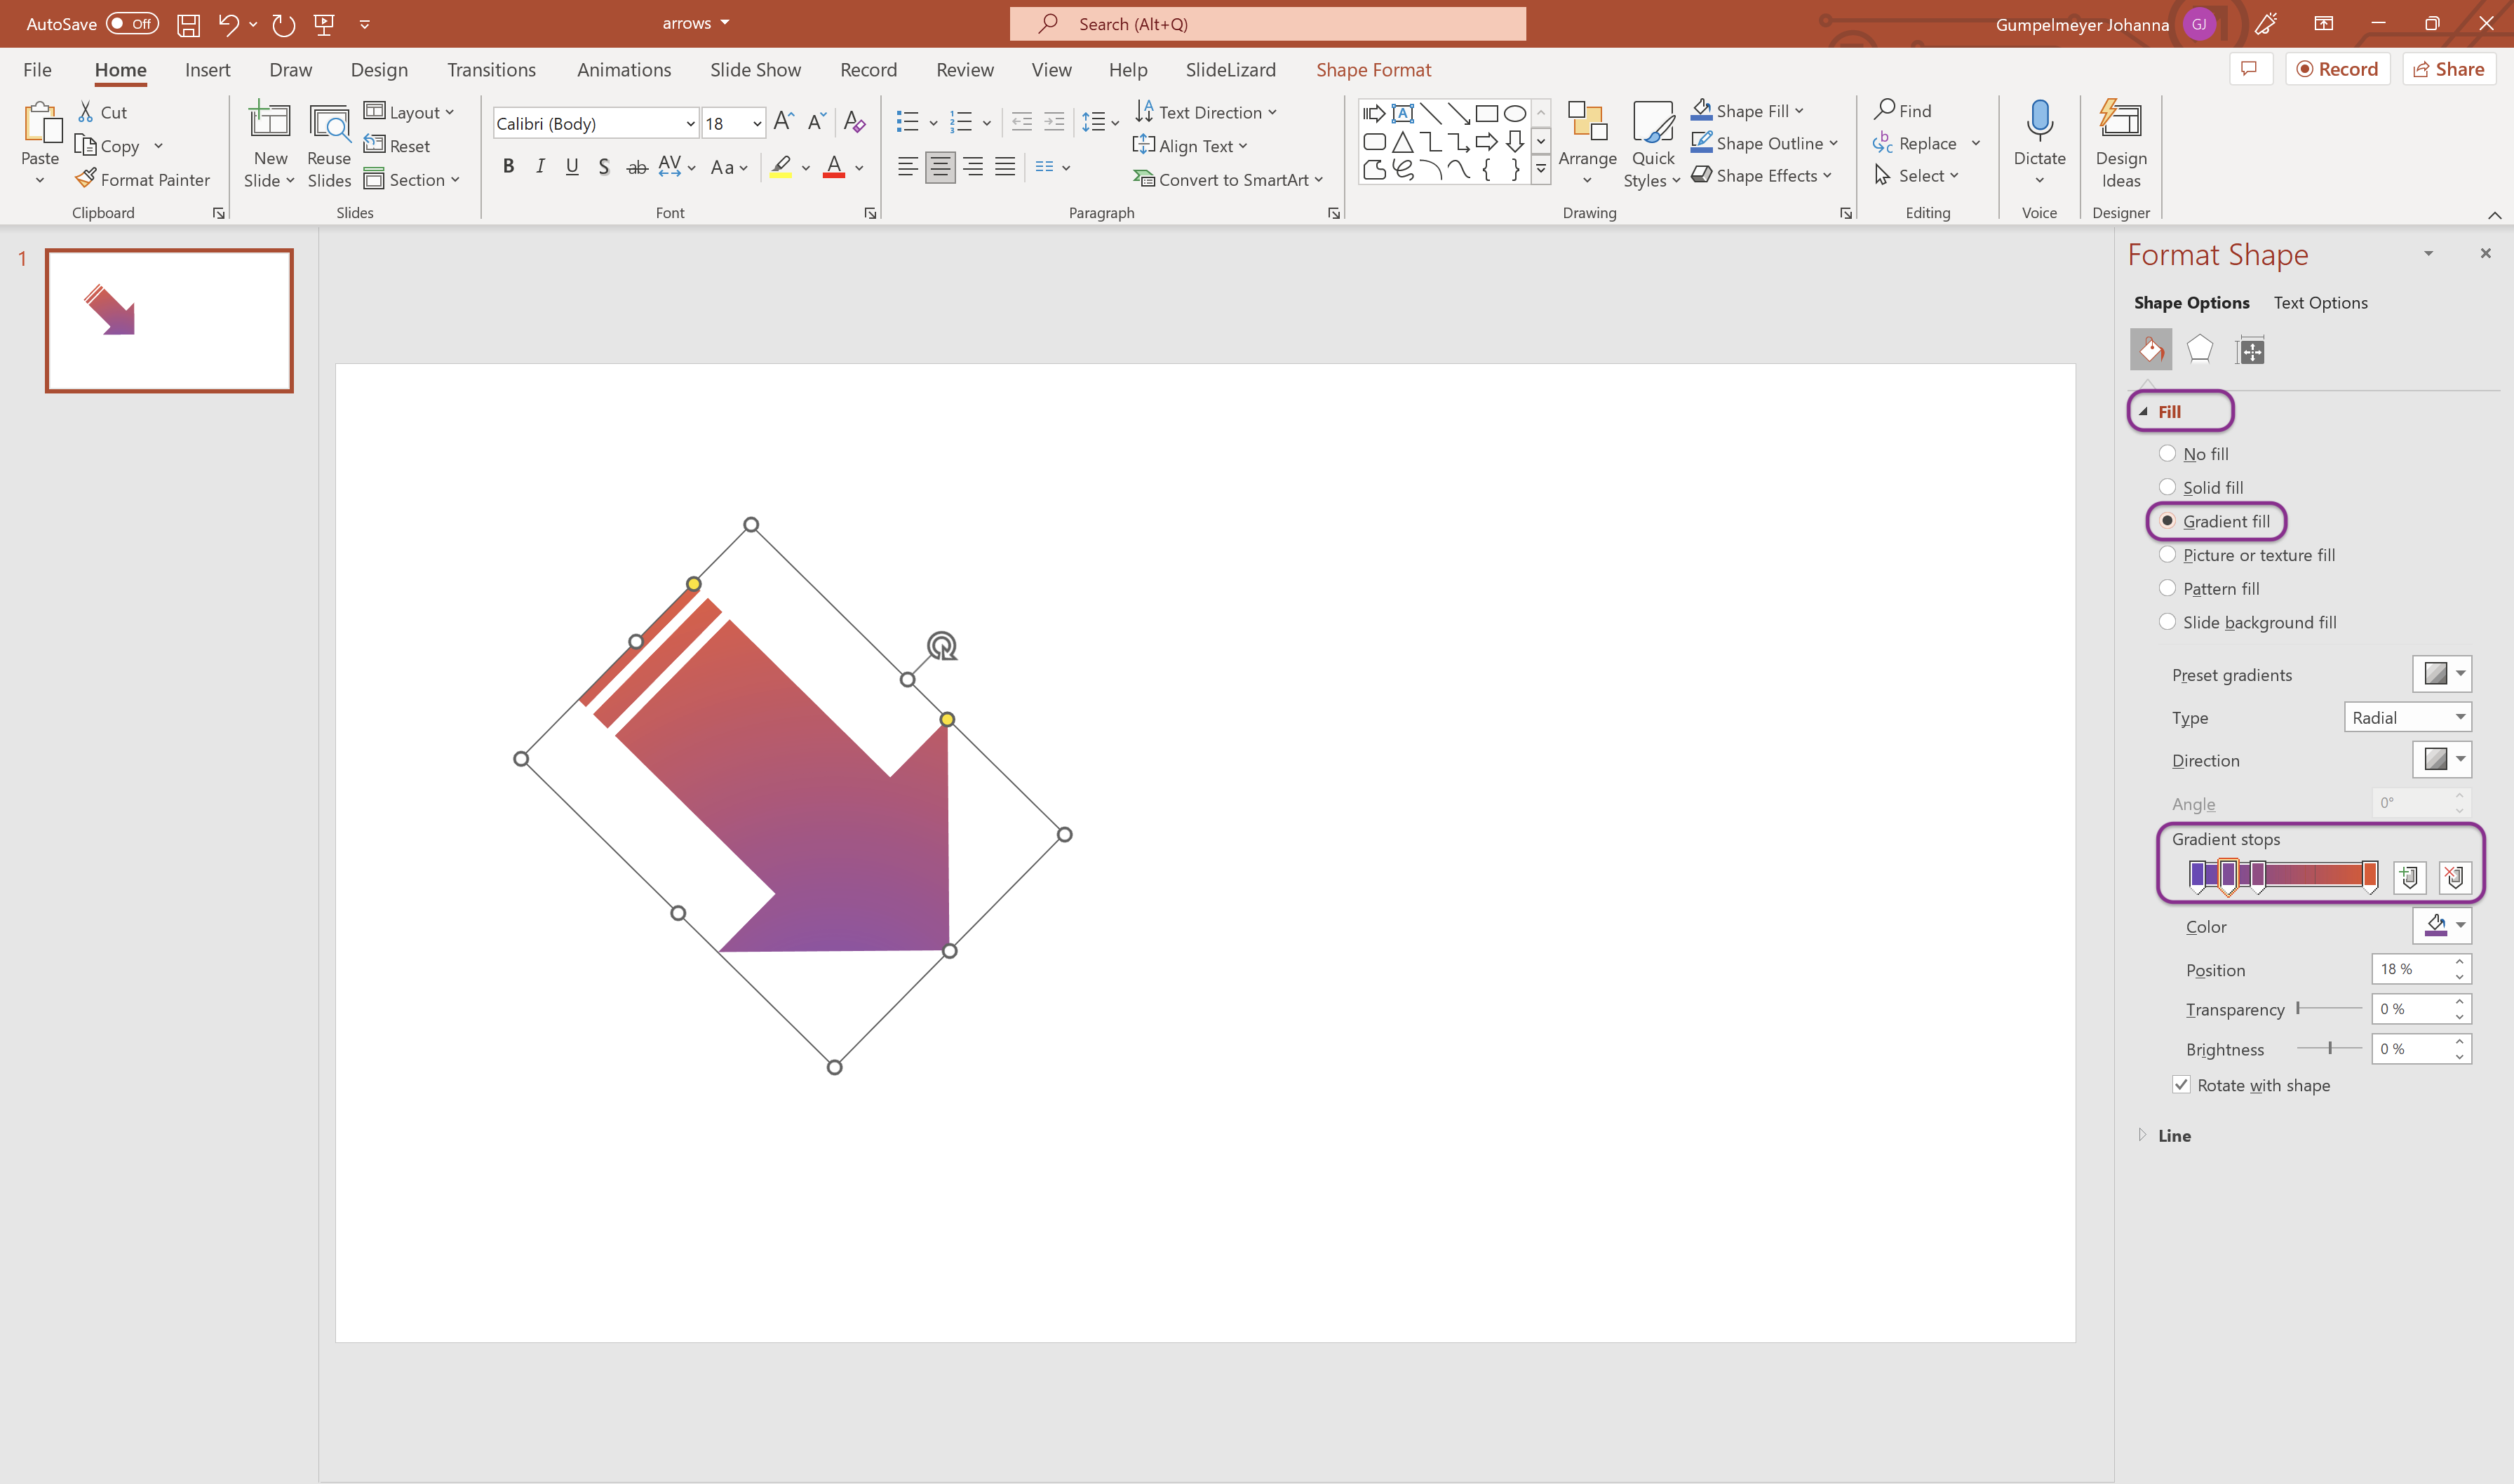
If you want to change the colors of your arrow click on Fill and
choose for example Gradient and select your desired colours.
![Select gradient]()
-
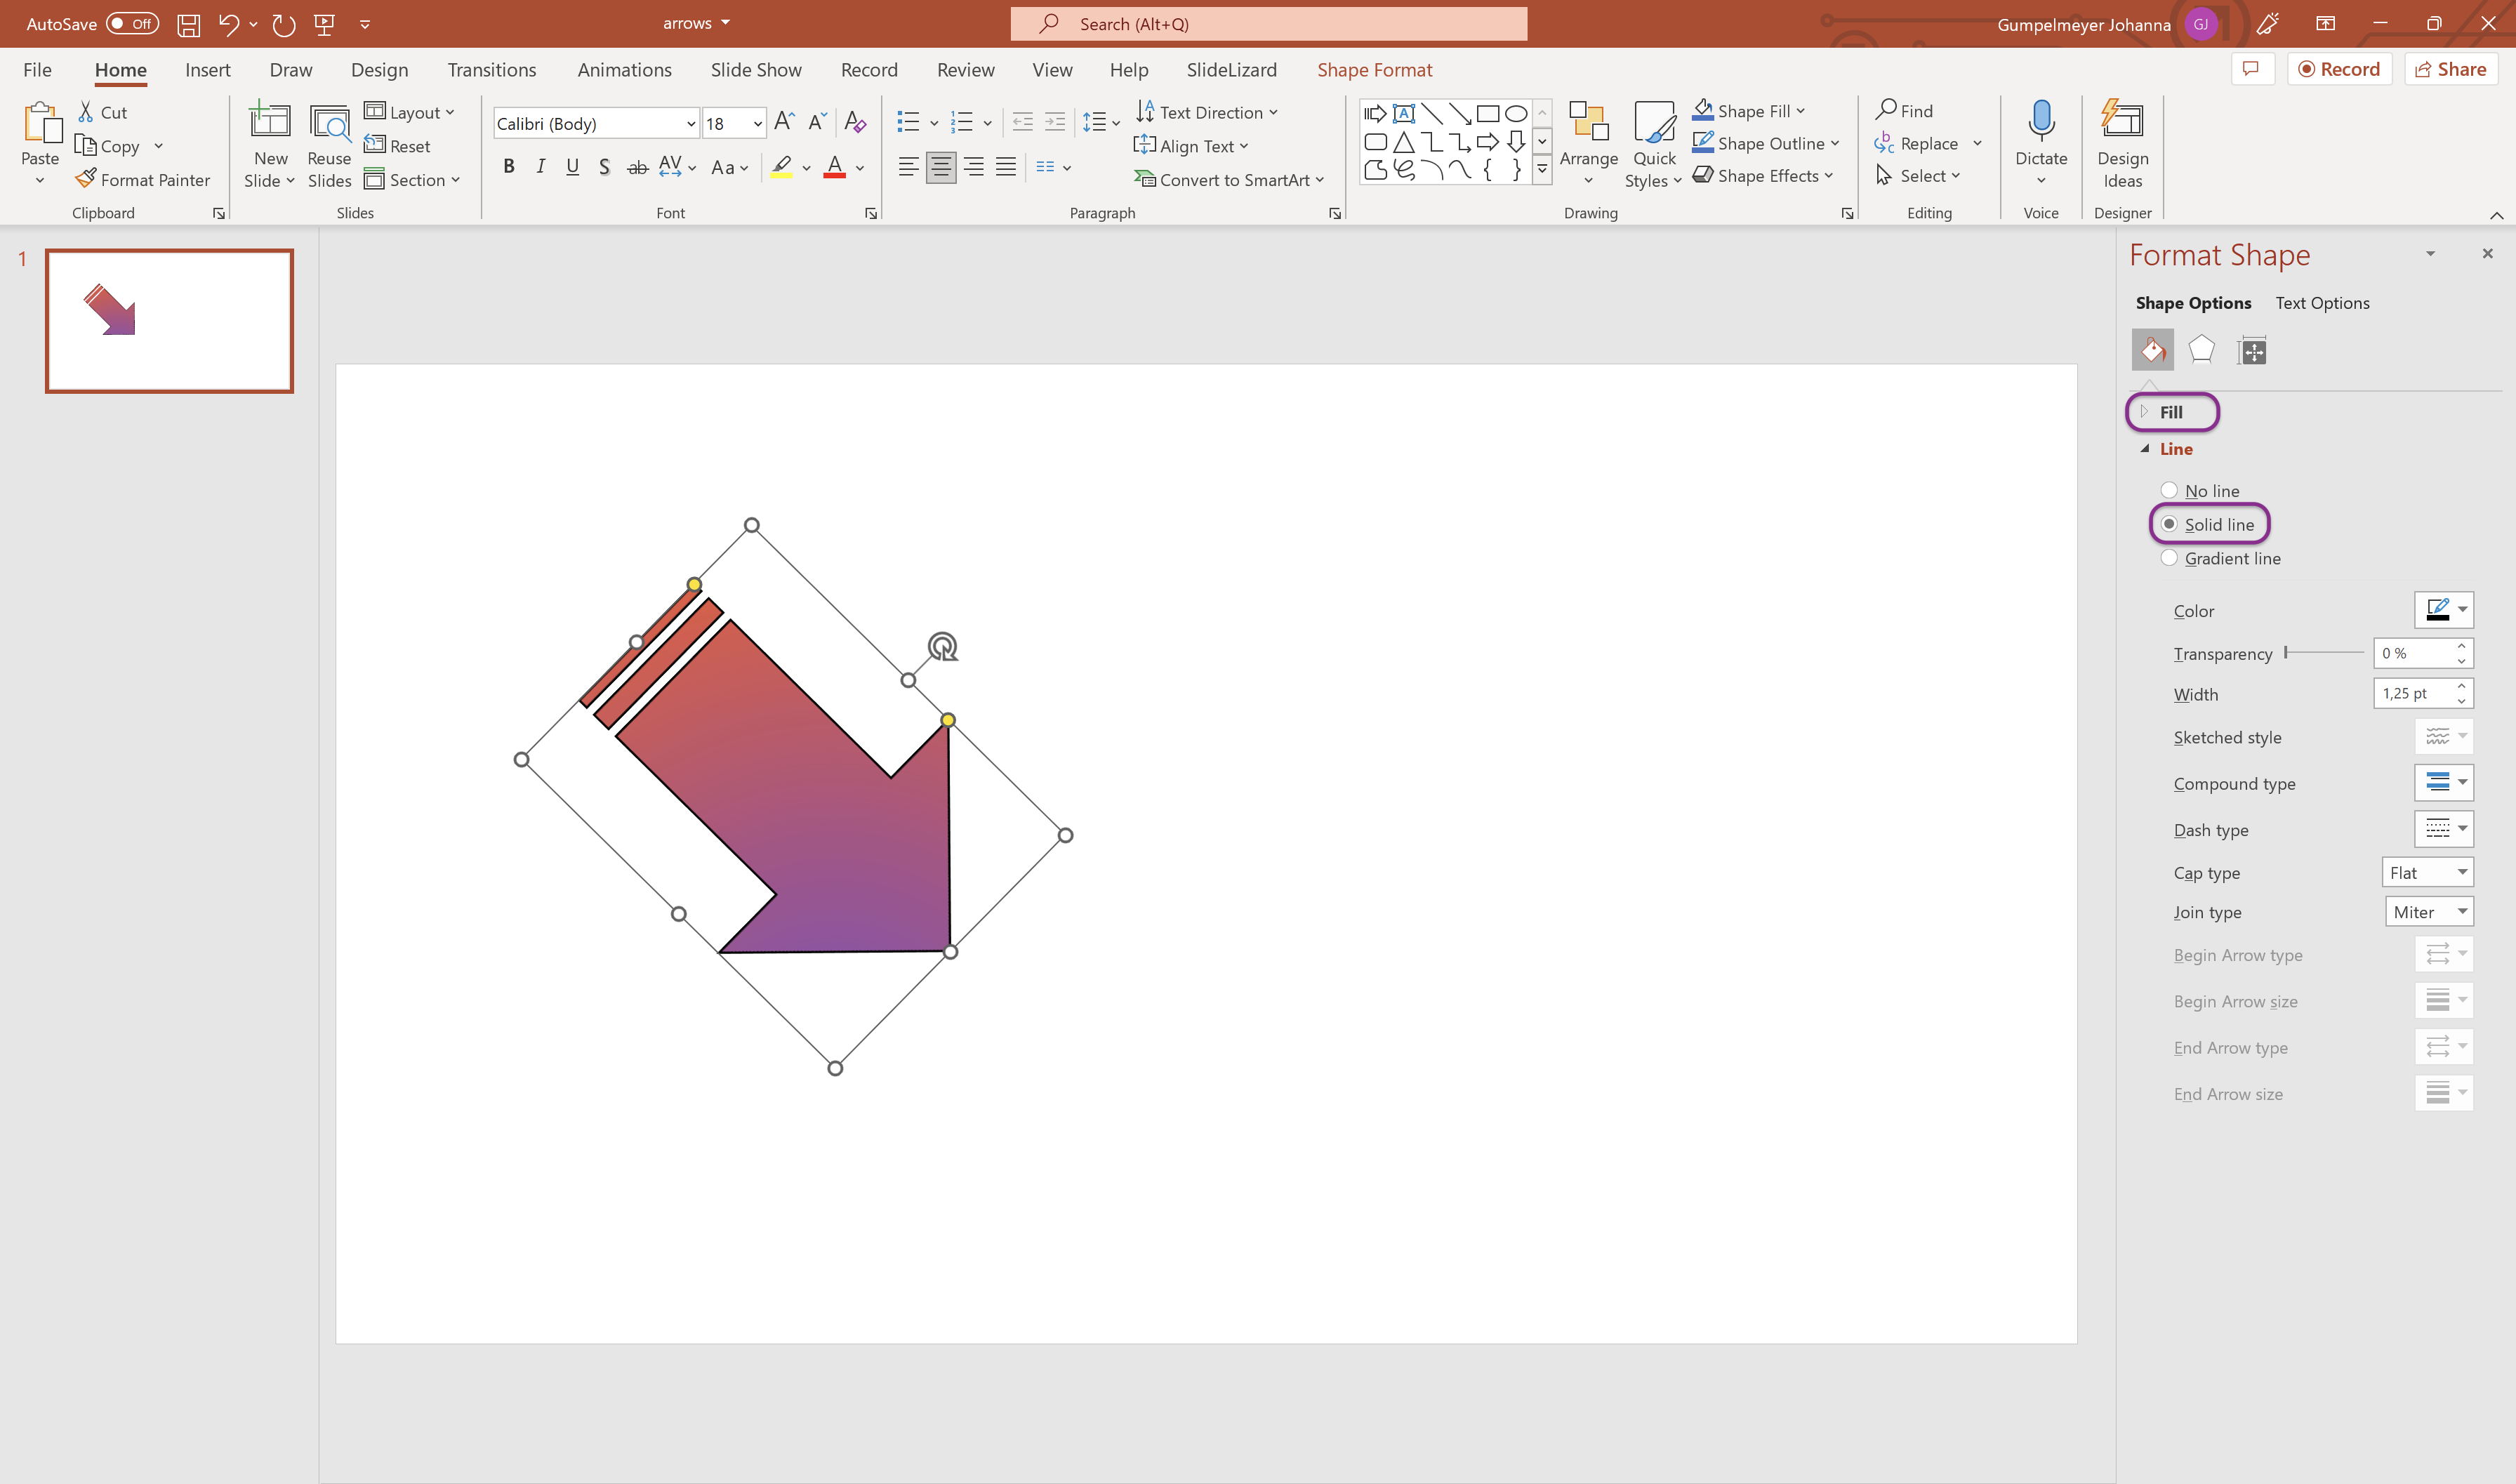
In the setting Line you can hide the contour of the arrow by choosing
No line or make it visible with Solid line.
![Select solid line]()
-
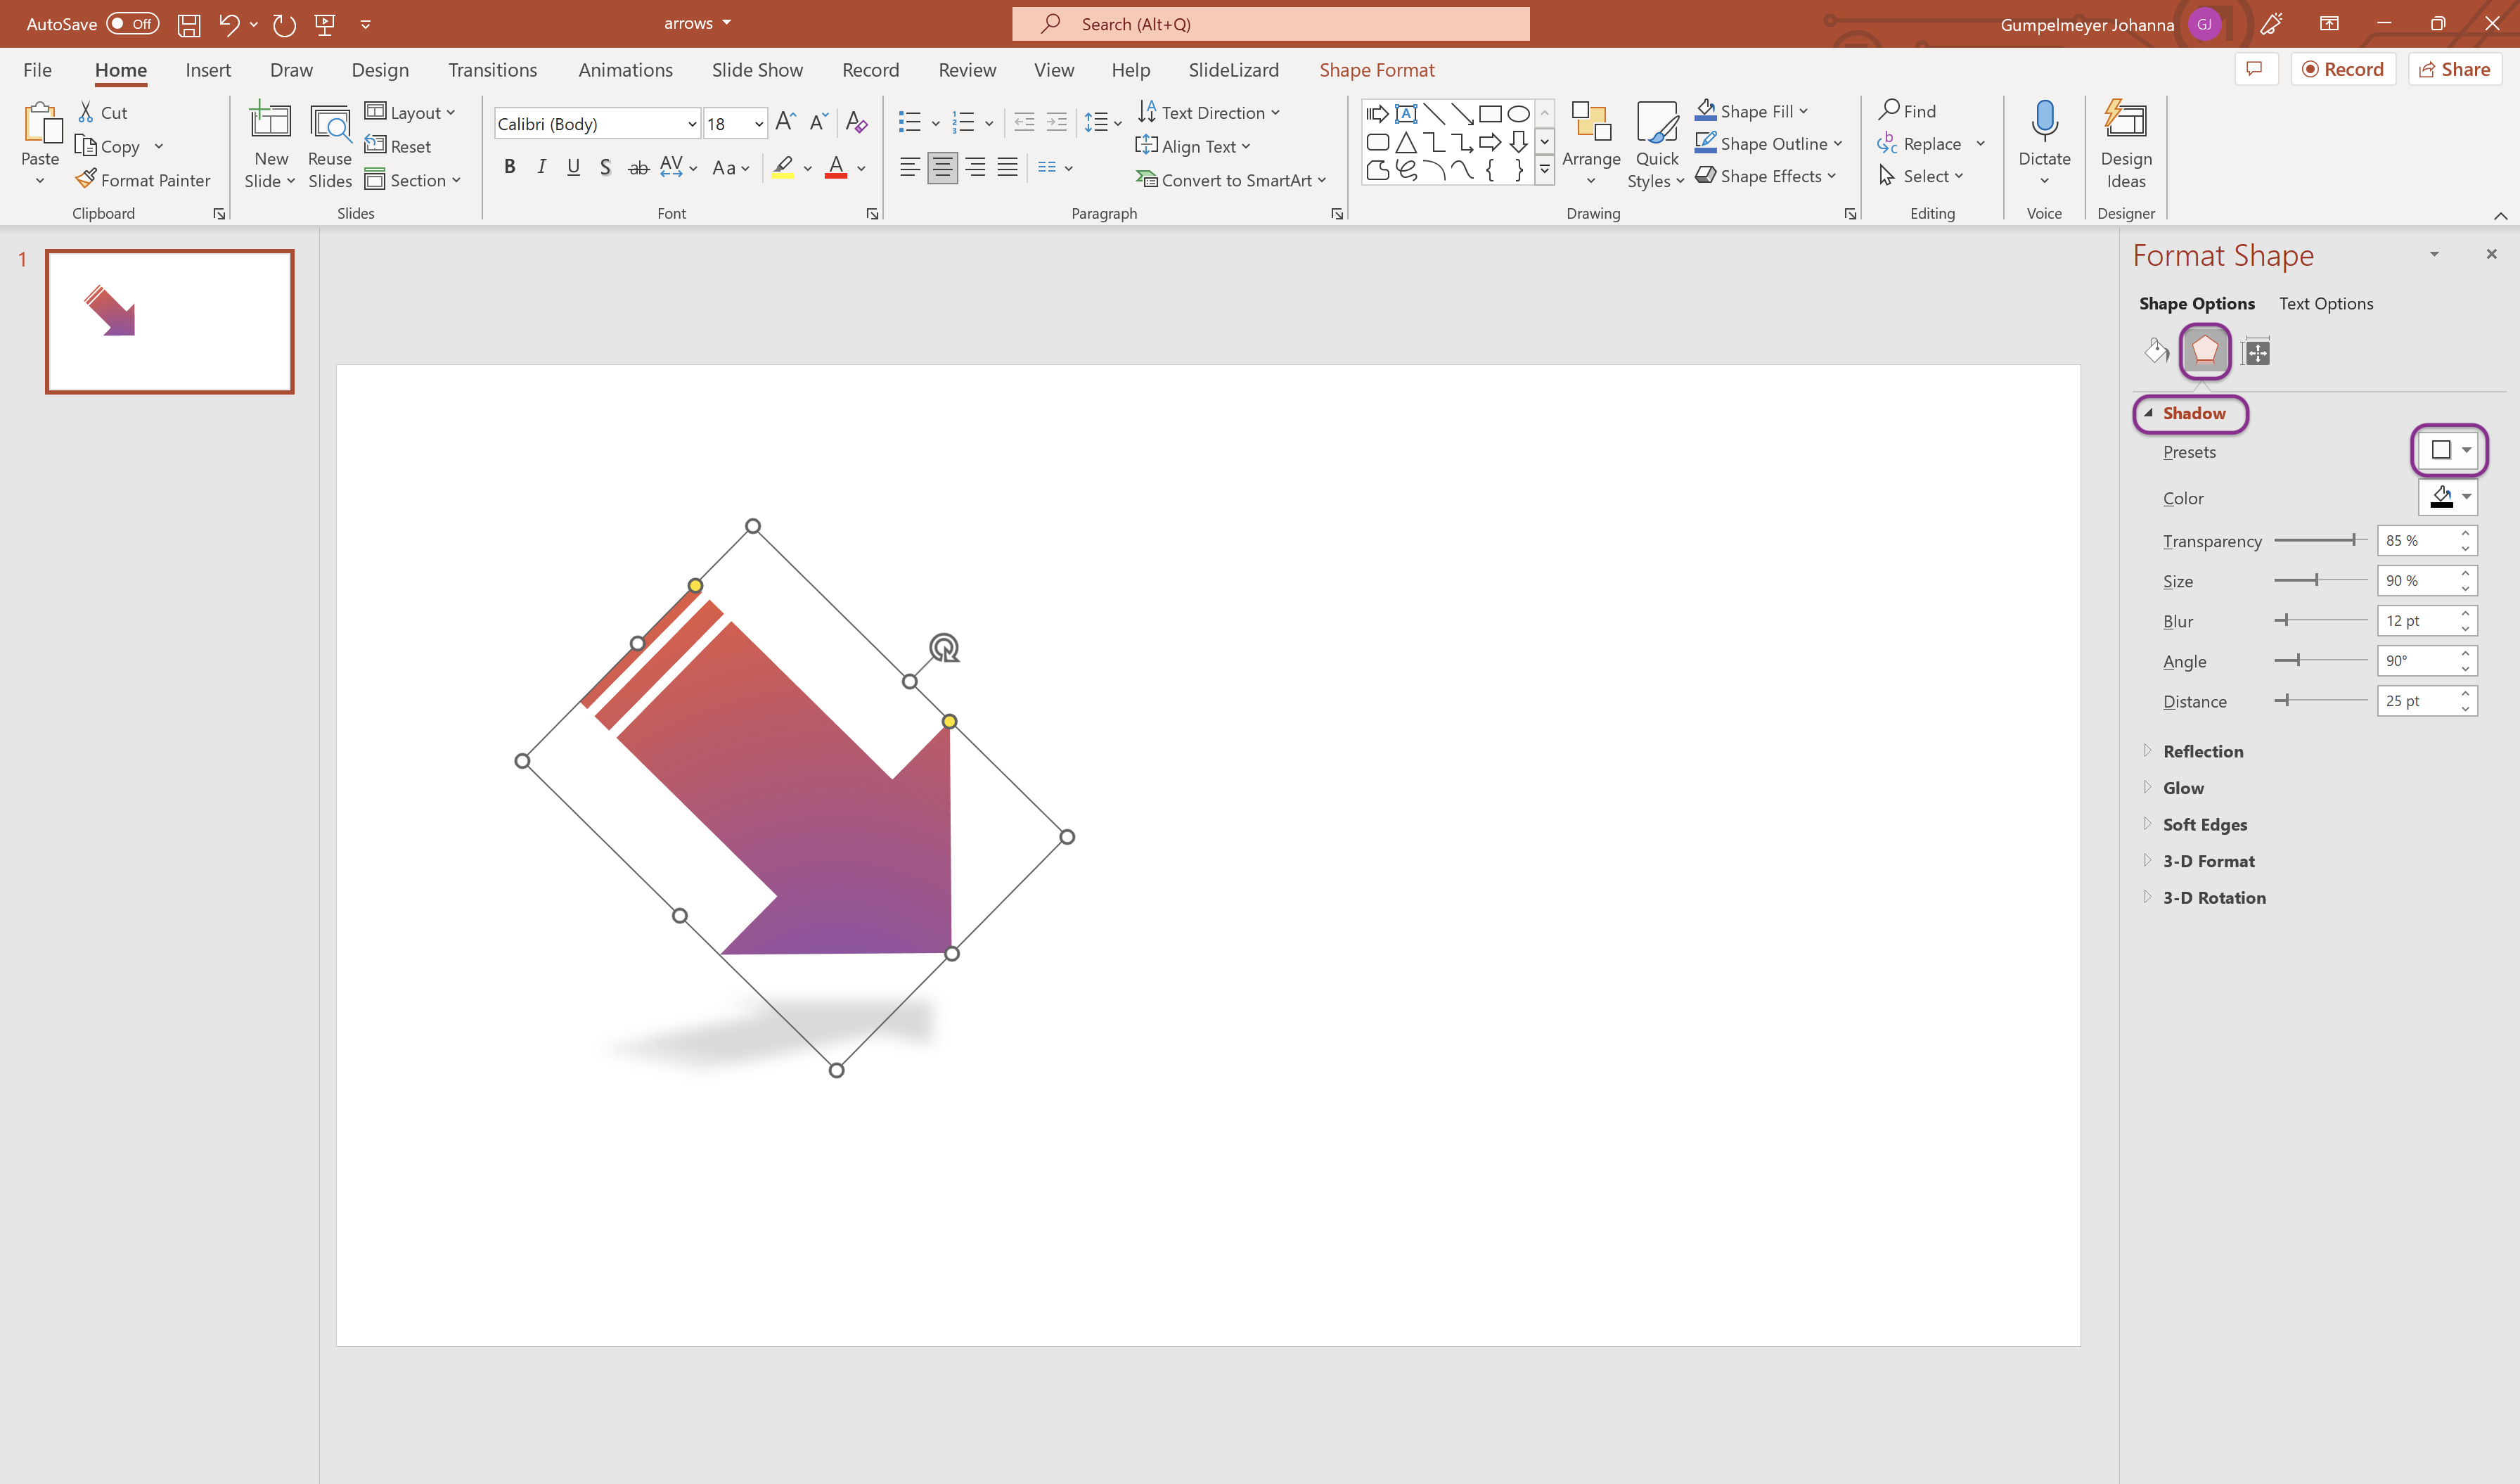
Under the pentagonal symbol you will find further items such as
Shadow, Reflection or Luminosity. To do this, simply
click on the heading and the further settings will be visible.
![Select shadow]()
4. Create curved arrows in PowerPoint
In PowerPoint you can also create curved arrows. Curved arrows are suitable for the representation of processes and can be easily extended. This is how it works:
-
Click on Insert and Shapes and select the arc in
Standard shapes. Click on the place where the arrow will be inserted.
![Choose arc]()
-
Hold down the left mouse button and drag the arrow to the desired size. If
you hold down the shift key (⇧) while inserting the arrow, it will not be
distorted and will be a circle at full length.
![Insert arc]()
-
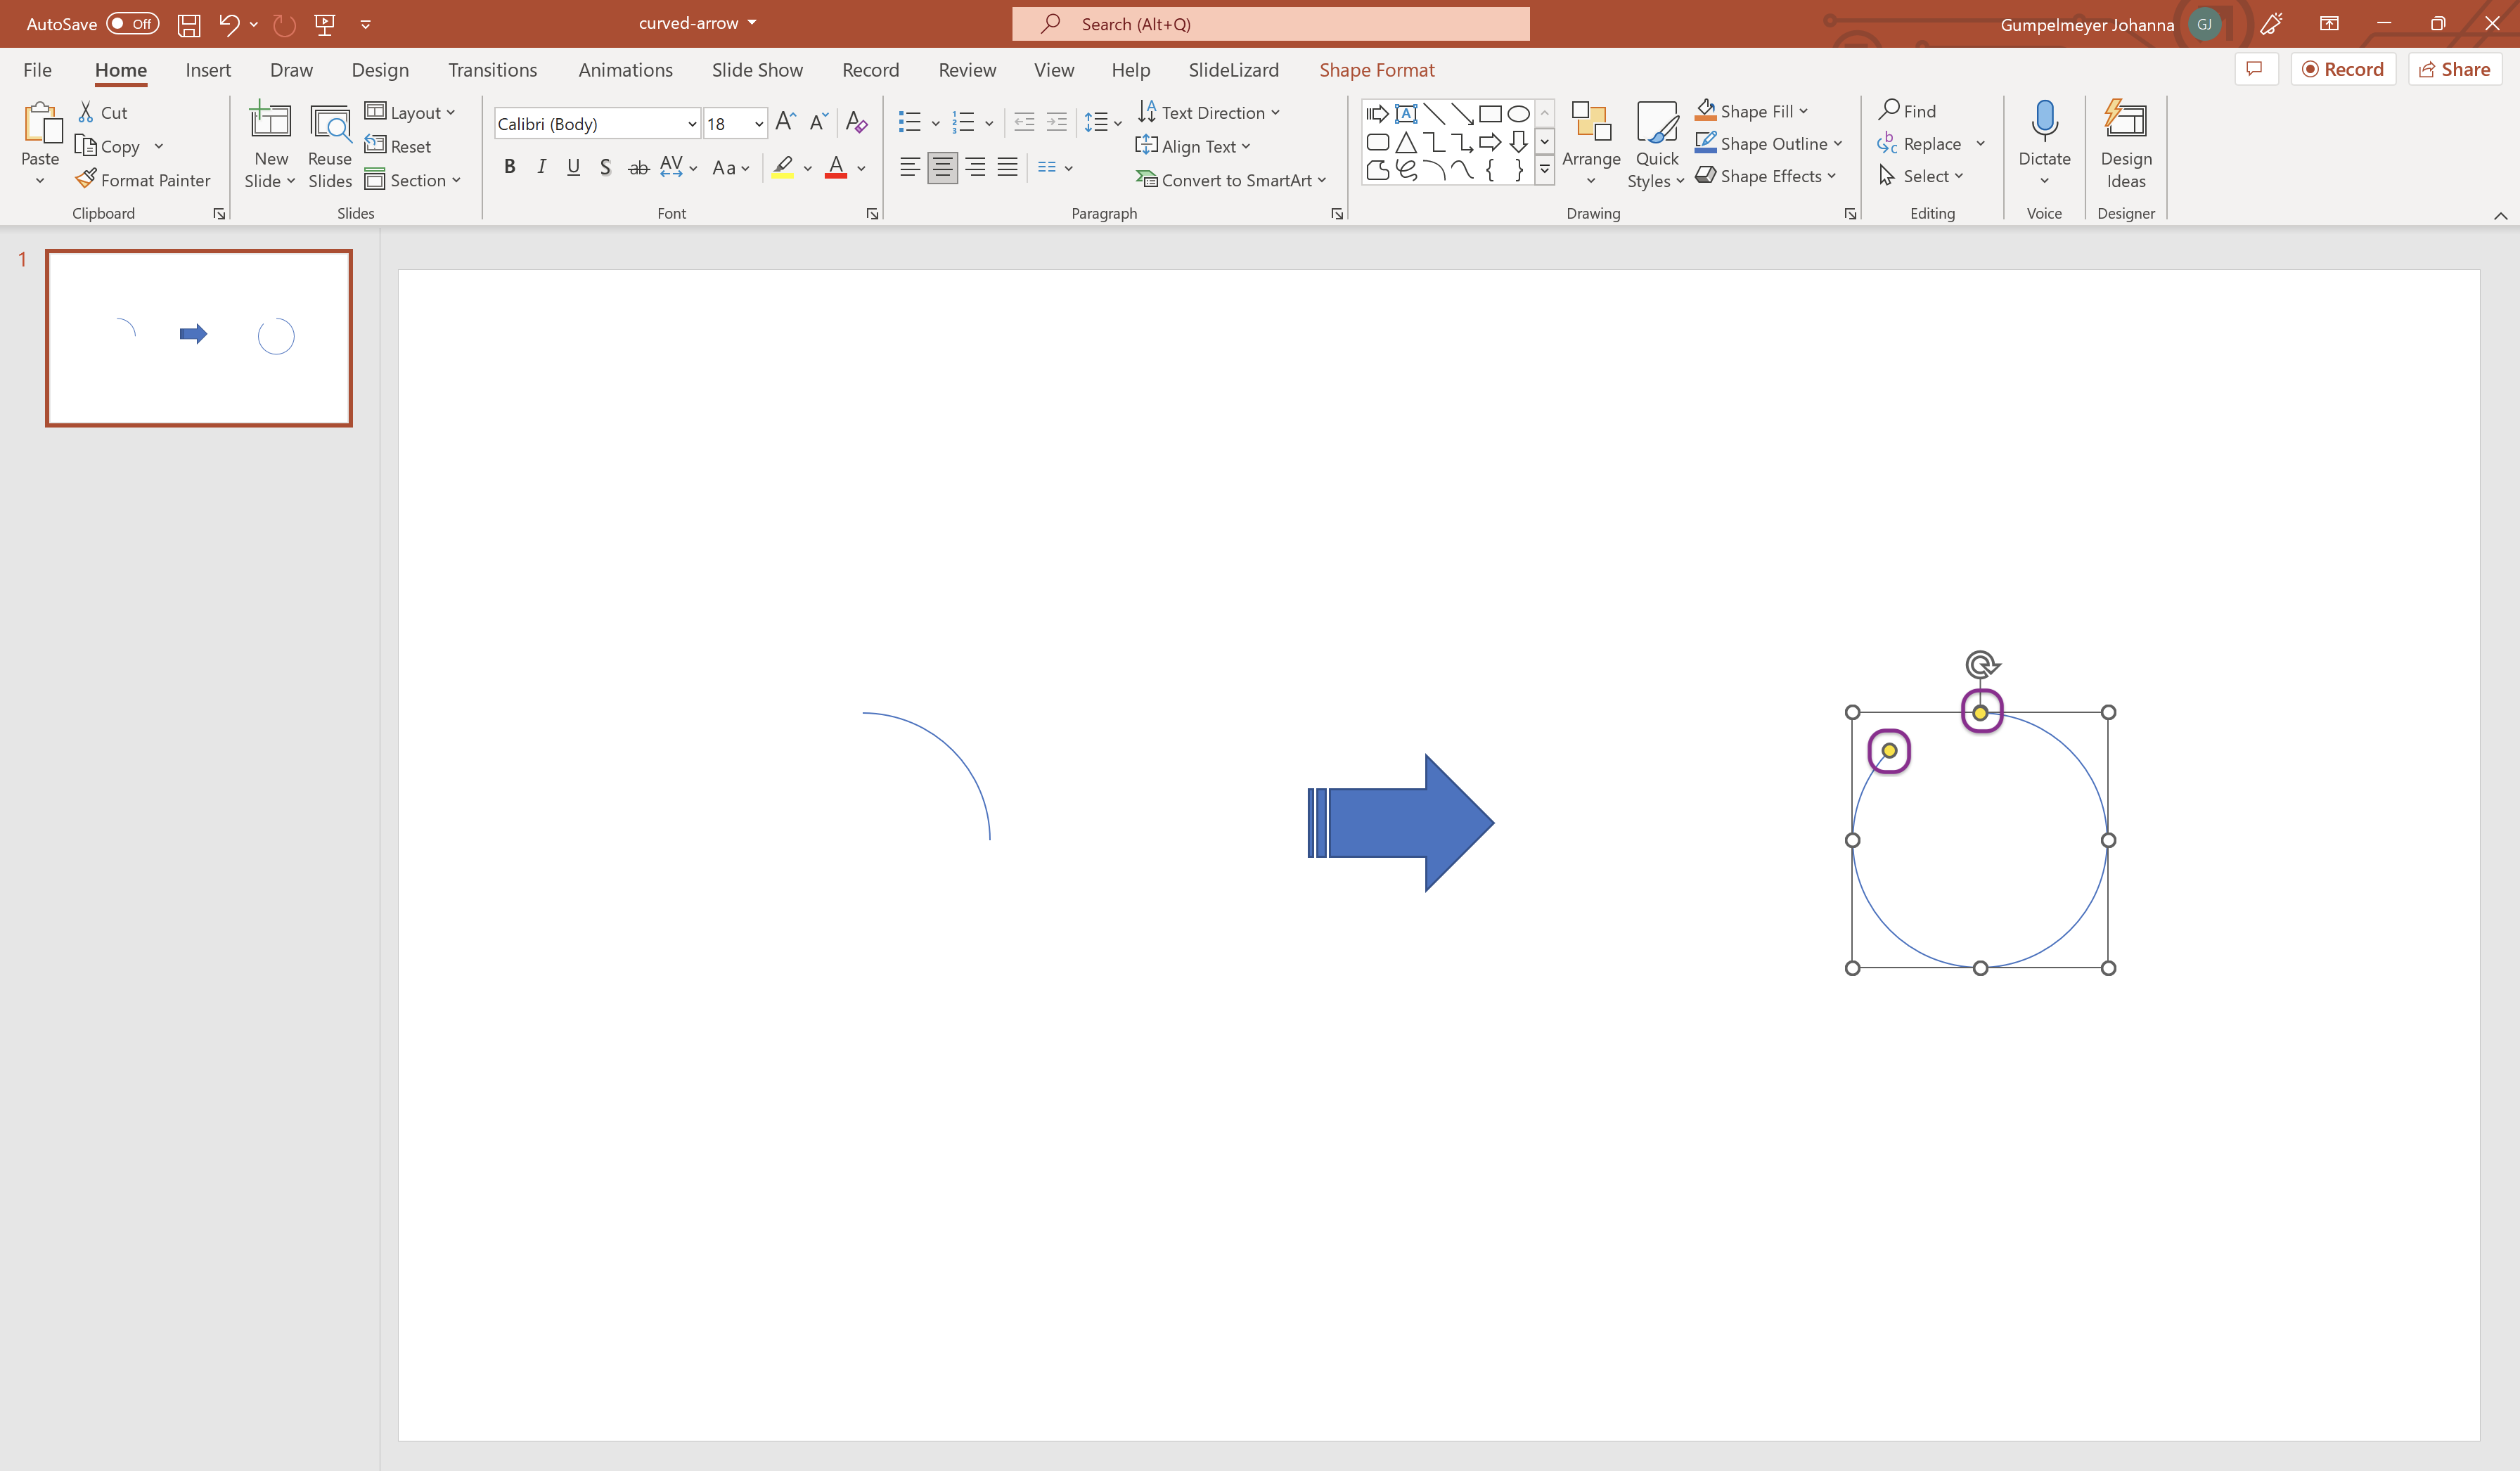
To adjust the length of the arrow, click on a yellow point and drag the
point to the desired length while holding down the mouse button.
![Extend arc]()
-
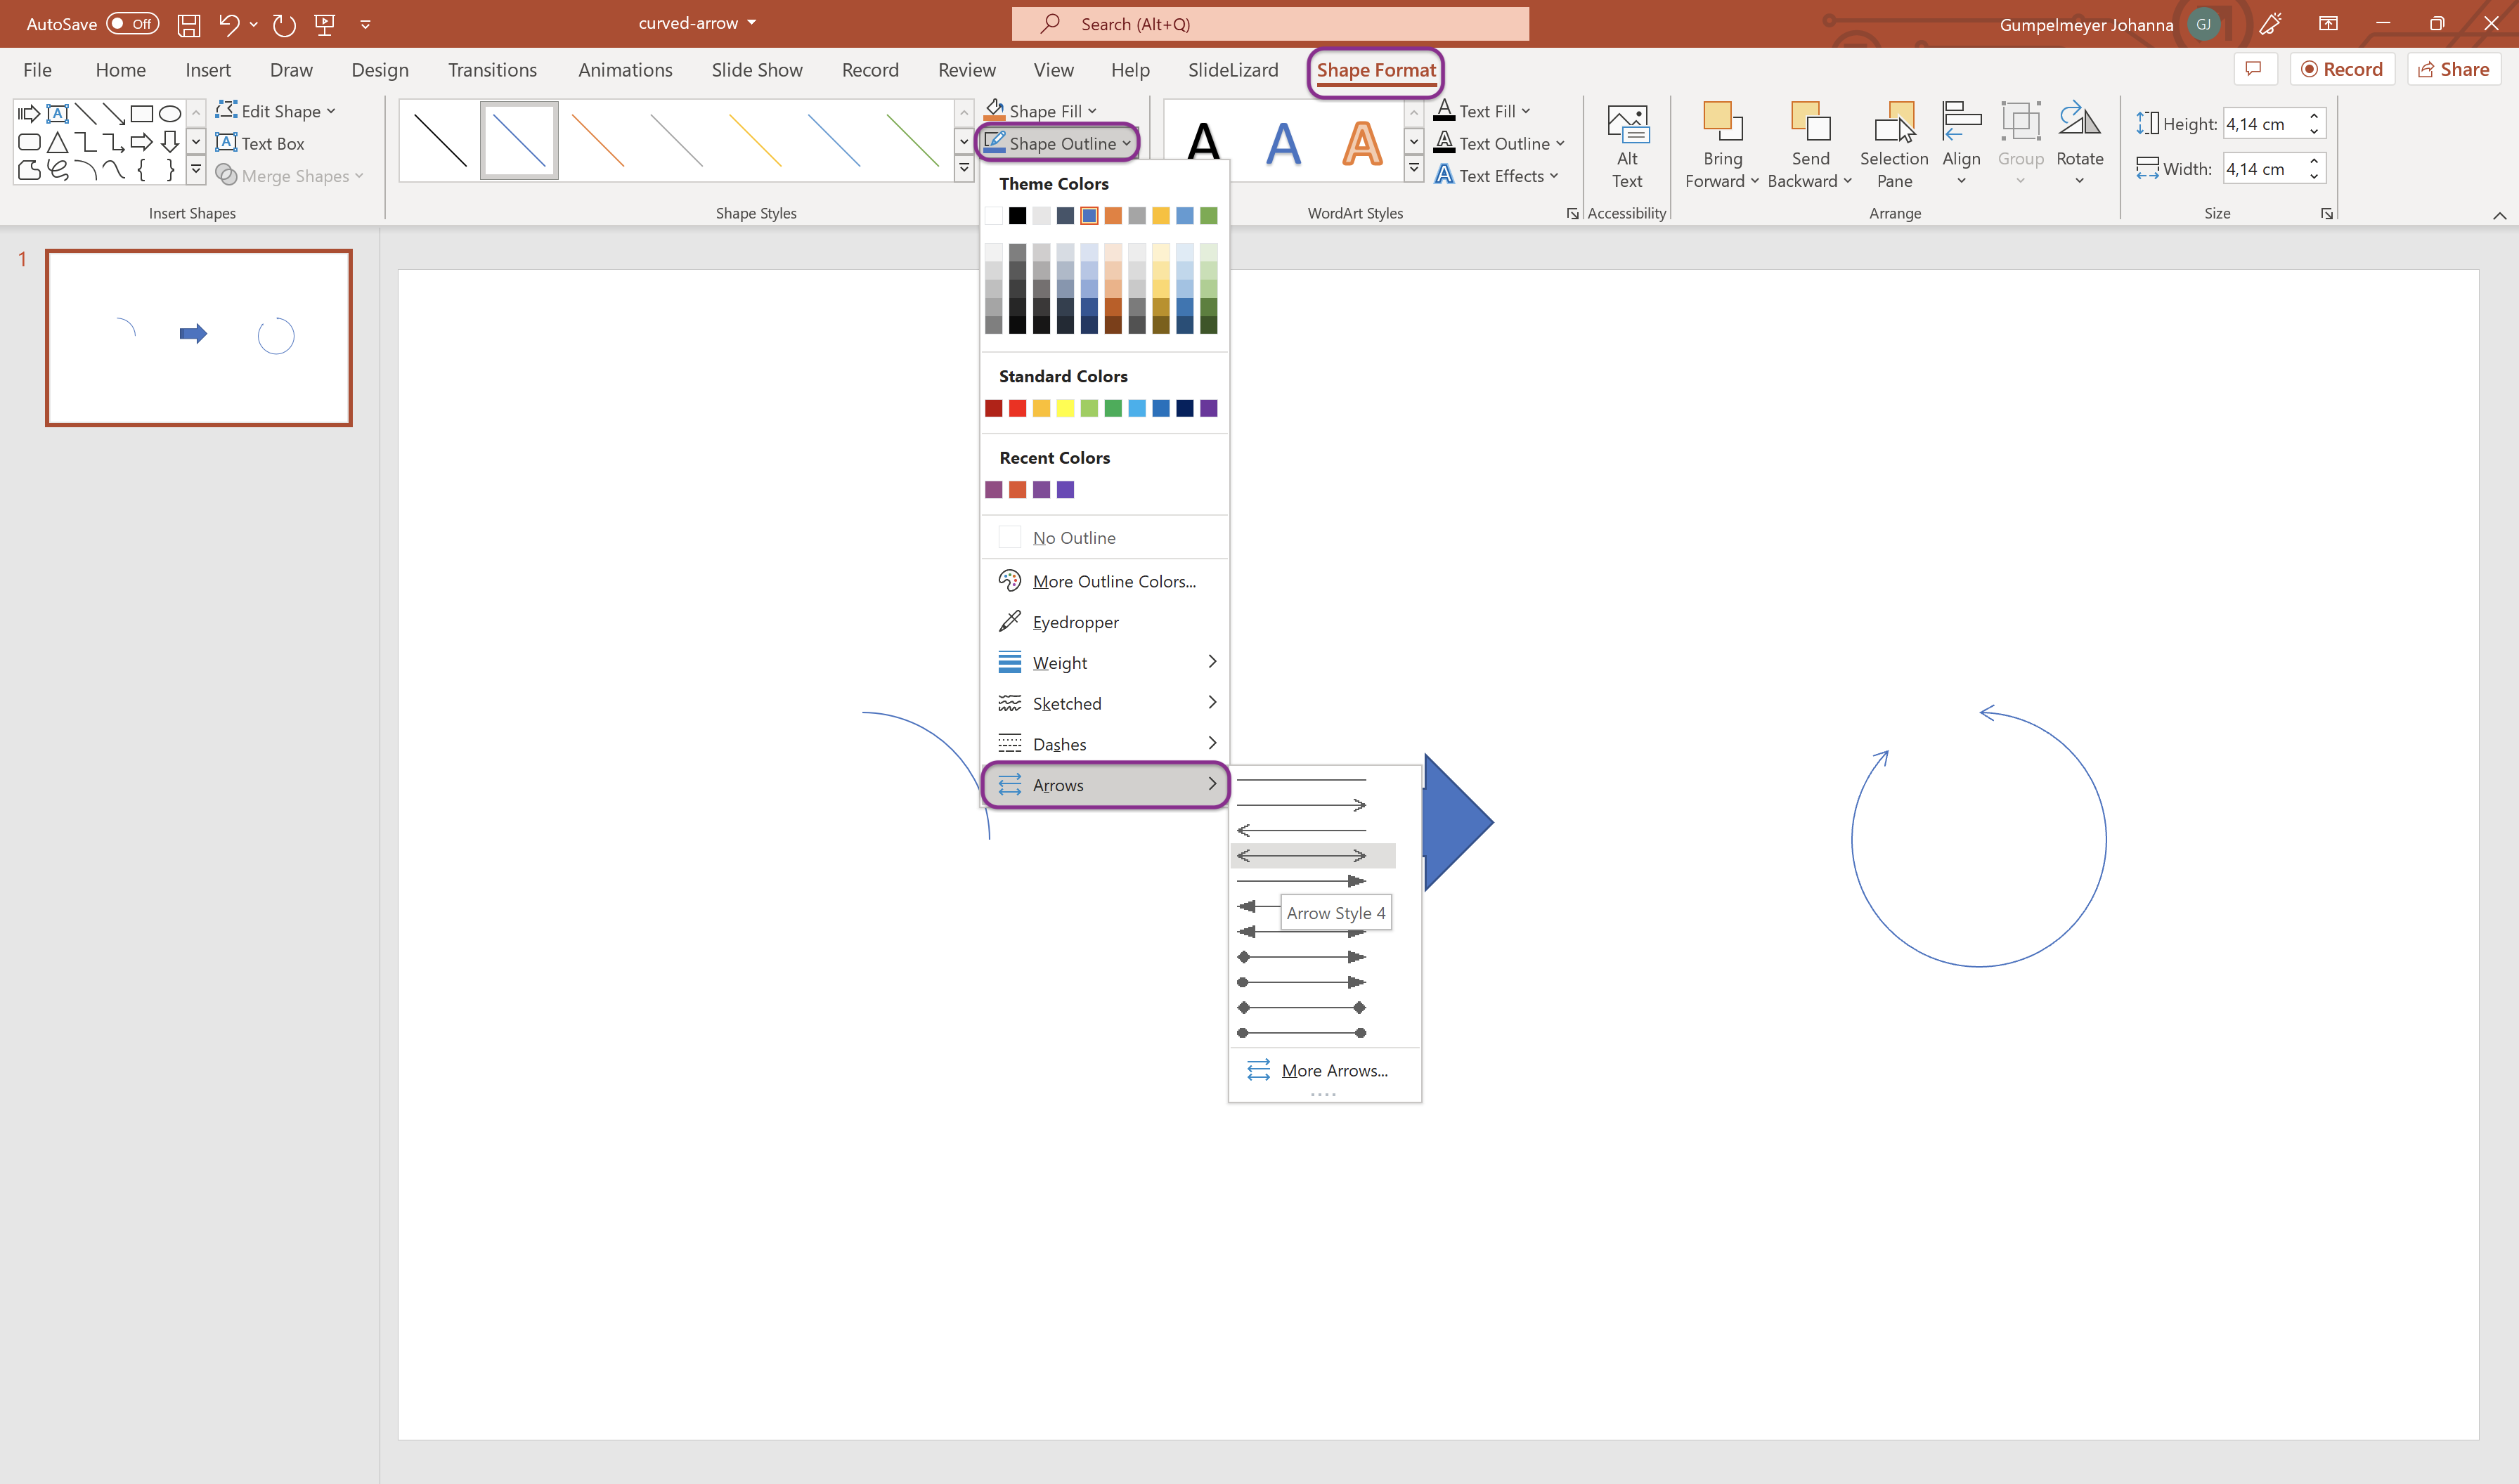
Now you have inserted an arc. To turn it into an arrow, click on the arc and
in the Shape format tab click on Shape contour. In
Arrows you can determine the desired tip and the end of your arrow.
![Choose arrow style]()
5. Create a cycle diagram in PowerPoint
You can create a cycle diagram in PowerPoint with single curved arrows. Another way to quickly visualise a cycle are SmartArts in PowerPoint. And this is how it works:
-
Click on Insert and select SmartArt.
![Select SmartArt]()
-
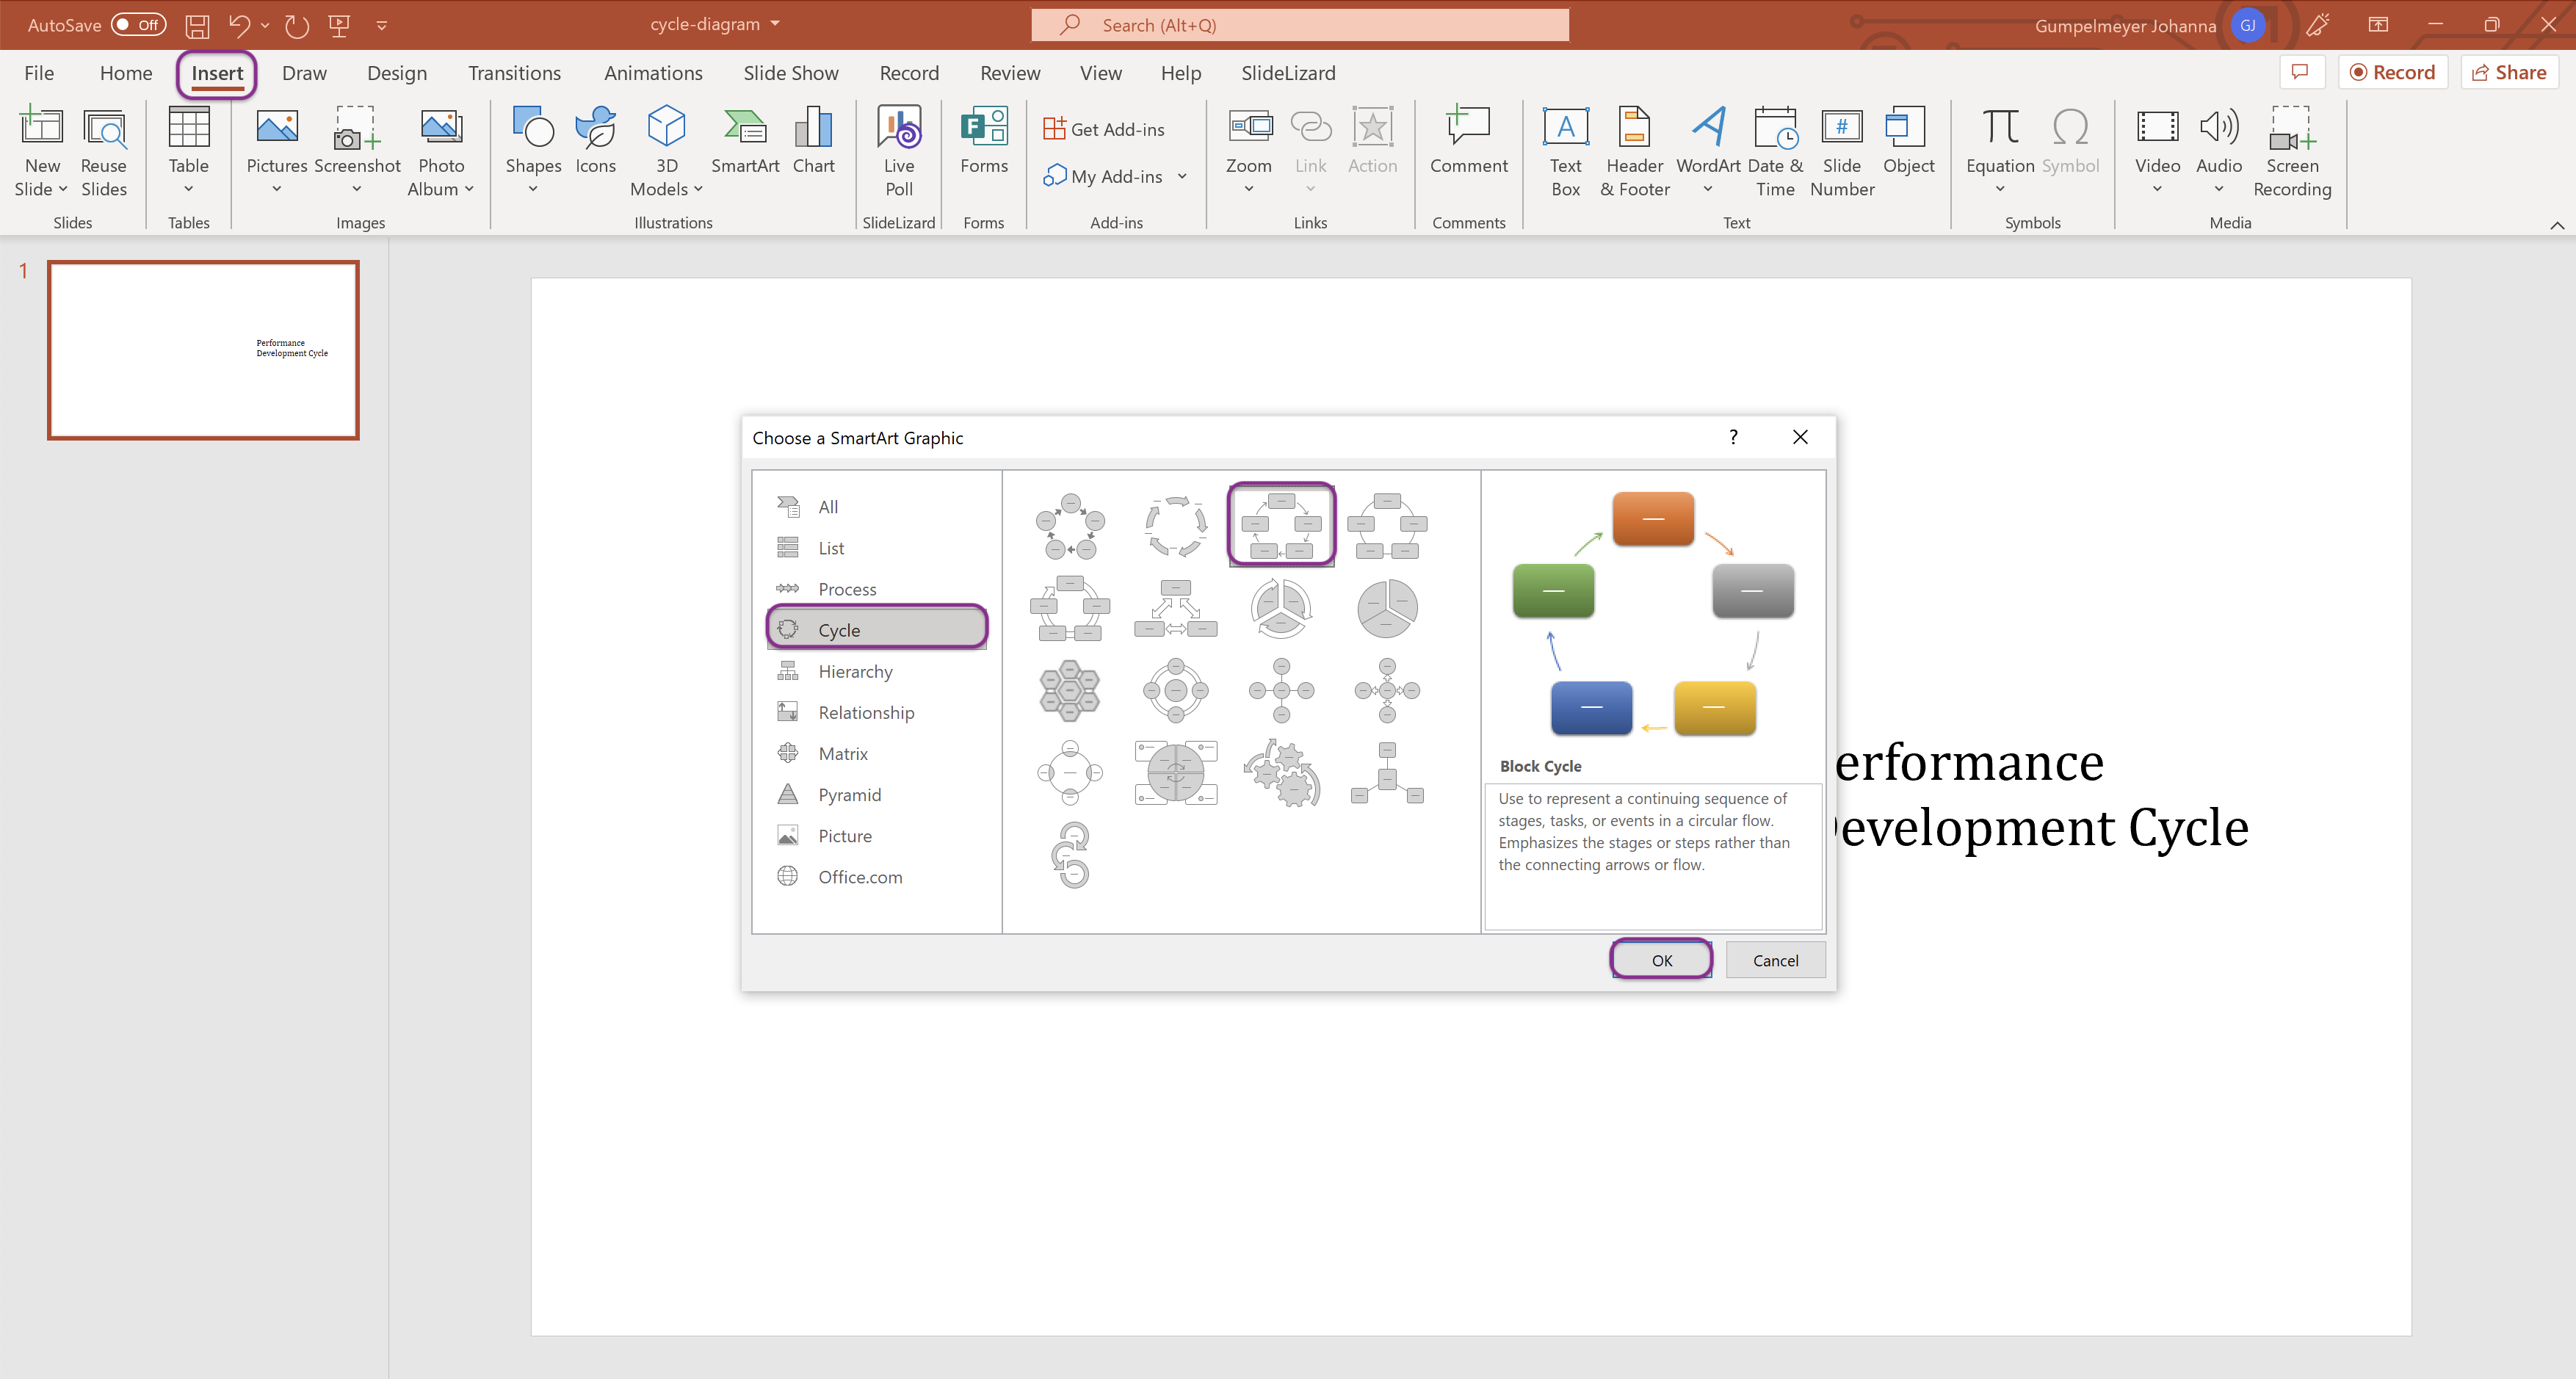
In the category Cycle you will find some pre-designed diagrams.
Select your desired design.
![Choose Cycle]()
-
To be able to insert your text now, click on [Text]. Label all fields and
your cycle diagram is ready.
![Label fields]()
-
In the section Change colours you can adjust the colours of the
SmartArt graphic.
![Change color]()
![Finished cycle diagram]()
6. Create more diagrams in PowerPoint
In addition to a cycle diagram, PowerPoint can also be used to quickly create flowcharts or decision diagrams. Learn how to create a Flowchart in PowerPoint in this blogpost.
FAQ
How to insert arrows in PowerPoint?
- Click on Insert and then on Shapes.
- Select the desired arrow.
- Click on the place where the arrow is to be inserted. Keep the left mouse button pressed and drag the arrow to the desired size.
How to create a cycle diagram in PowerPoint?
- Click on Insert and then choose SmartArt.
- In the category Cycle you will find some predesigned cycle diagrams.
- Label all fields by clicking on [Text] and your cycle diagram is ready.


